Consider the following table. Defects in batchProbability 2. 0.35 3. 0.23 4. 0.20 5. 0.09 6. ...
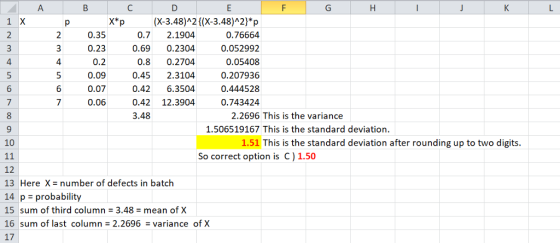
Consider the following table.
Defects in batchProbability
2. 0.35
3. 0.23
4. 0.20
5. 0.09
6. 0.07
7. 0.06
Find the standard deviation of this variable.
2.27
3.48
1.51
4.50
Homework Answers
Let's make table in excel:
THe formulae used on the above excel-sheet are as
follows:
Add Answer to:
Consider the following table.
Defects in batchProbability
2. 0.35
3. 0.23
4. 0.20
5. 0.09
6. ...
Consider the following table. Defects in batch Probability 2 0.21 3 0.37 4 0.22 5 0.10...
Consider the following table. Defects in batch Probability 2 0.21 3 0.37 4 0.22 5 0.10 6 0.07 7 0.03 Find the standard deviation of this variable which is one of these answers: 1.64 1.65 3.54 1.28
Consider the following table: Defects in batch Probability 0 0.30 1 0.28 2 0.21 3 0.09...
Consider the following table: Defects in batch Probability 0 0.30 1 0.28 2 0.21 3 0.09 4 0.08 5 0.04 Find the standard deviation of this variable. 1.49 1.99 0.67 1.41
Q5. Consider the following table. Defects in batch Probability 0 0.09 1 0.24 2 0.41 3...
Q5. Consider the following table. Defects in batch Probability 0 0.09 1 0.24 2 0.41 3 0.12 4 0.10 5 0.04 Find the variance of this variable. Homework Help: 3VA. Calculating the mean, variance, and standard deviation of discrete variables (Links to an external site.) (4:35) 3DC. Mean, expected value, variance, and standard deviation of discrete variables (Links to an external site.) (DOCX) Group of answer choices 2.02 1.48 1.22 1.43 Q6 Consider the following table. Defects in batch Probability...
Accidents_Daily_(X) P(X=xi) 0 0.23 1 0.24 2 0.21 3 0.11 4 0.09 5 0.07 6 0.05...
Accidents_Daily_(X) P(X=xi) 0 0.23 1 0.24 2 0.21 3 0.11 4 0.09 5 0.07 6 0.05 What is the probability that there will be at least 2 accidents on a given day?
Accidents_Daily_(X) P(X=xi) 0 0.23 1 0.24 2 0.21 3 0.11 4 0.09 5 0.07 6 0.05...
Accidents_Daily_(X) P(X=xi) 0 0.23 1 0.24 2 0.21 3 0.11 4 0.09 5 0.07 6 0.05 Compute the mean number of accidents per day.
Question 3 2 pts (CO 4) Consider the following table Defects in batch Probability 0.04 0.11...
 Question 3 2 pts (CO 4) Consider the following table Defects in batch Probability 0.04 0.11 0.25 0.20 0.19 0.21 2 3 4 Find the variance of this variable. 1.41 2.08 3.02 1.44
For the following probability distribution x fx) 0 0.01 0.02 0.10 0.35 4 0.20 0.18 0.06...
 For the following probability distribution x fx) 0 0.01 0.02 0.10 0.35 4 0.20 0.18 0.06 0.05 0.09 0.03 0.10 Upload a file detailing all of the work needed for these questions. a. b. c. Determine E(x). (2 points) Determine the variance. (2 points) Determine the standard deviation. (1 point)
Problem 5 Consider the following probability distribution. 0 1 2 3 4 5 6 7 fx...
 Problem 5 Consider the following probability distribution. 0 1 2 3 4 5 6 7 fx (2) | 0.18 0.08 0.01 0.23 0.08 0.09 0.24 0.09 What is the mathematical expectation for U(x) = x2? 3.63 18.77 5.59 17.77
Stock A Stock B 1 0.09 0.07 2 0.06 0.03 3 0.13 0.04 4 -0.03 ...
Stock A Stock B 1 0.09 0.07 2 0.06 0.03 3 0.13 0.04 4 -0.03 0.02 5 0.08 -0.04 a. What are the expected returns of the two stocks? b. What are the standard deviations of the returns of the two stocks? c. If their correlation is 0.43, what is the expected return and standard deviation of a portfolio of 62% stock A and 38% stock B?
N 에 3 5 who 4 ulu m 11 10 Table: Branch Information X(pu) B{pu) Branch...
 N 에 3 5 who 4 ulu m 11 10 Table: Branch Information X(pu) B{pu) Branch Bus No-Bus No 1-2 2-5 2-8 4-5 4.11 5-6 6-7 7-10 7-11 8-9 8 - 10 9-10 R(pu) 0.01 0.02 0.025 0.01 0.01 0.02 0.04 0.03 0.01 0.05 0.01 0.01 0.02 0.03 0.06 0.075 0.03 0.03 0.06 0.12 0.09 0.07 0.15 0.03 0.07 0.14 0.04 0.08 0.00 0.02 0.06 0.00 0.00 0.02 0.10 0.00 0.06 0.12 0.04 Calculate the bus admittance matrix for the...
 Question 3 2 pts (CO 4) Consider the following table Defects in batch Probability 0.04 0.11 0.25 0.20 0.19 0.21 2 3 4 Find the variance of this variable. 1.41 2.08 3.02 1.44
 For the following probability distribution x fx) 0 0.01 0.02 0.10 0.35 4 0.20 0.18 0.06 0.05 0.09 0.03 0.10 Upload a file detailing all of the work needed for these questions. a. b. c. Determine E(x). (2 points) Determine the variance. (2 points) Determine the standard deviation. (1 point)
 Problem 5 Consider the following probability distribution. 0 1 2 3 4 5 6 7 fx (2) | 0.18 0.08 0.01 0.23 0.08 0.09 0.24 0.09 What is the mathematical expectation for U(x) = x2? 3.63 18.77 5.59 17.77
 N 에 3 5 who 4 ulu m 11 10 Table: Branch Information X(pu) B{pu) Branch Bus No-Bus No 1-2 2-5 2-8 4-5 4.11 5-6 6-7 7-10 7-11 8-9 8 - 10 9-10 R(pu) 0.01 0.02 0.025 0.01 0.01 0.02 0.04 0.03 0.01 0.05 0.01 0.01 0.02 0.03 0.06 0.075 0.03 0.03 0.06 0.12 0.09 0.07 0.15 0.03 0.07 0.14 0.04 0.08 0.00 0.02 0.06 0.00 0.00 0.02 0.10 0.00 0.06 0.12 0.04 Calculate the bus admittance matrix for the...
Most questions answered within 3 hours.
-
Please use Logicly!
Create a 4 bit sequential counter that is capable of counting up
or...
asked 2 minutes ago -
I1(t) and I2(t) describe the intensity of two
light waves.
I1(t)= 10sin(30t+π/4)
I2(t)=
10sin(30.4t+π)
Assume that...
asked 6 minutes ago -
A sample of steam with a mass of 0.501 g at a temperature of 100
∘C...
asked 12 minutes ago -
A block sits on the floor. (a) What is the magnitude of the
frictional force on...
asked 13 minutes ago -
state one specific part from disability law such as ADA
(Americans with Disability Acts) or policy...
asked 14 minutes ago -
please simplify how vapor pressure lowering is related to a
rise in the boiling point solution
asked 28 minutes ago -
write a java program that does the following
Part one
Use a For loop to compute...
asked 26 minutes ago -
"A student in another class made a claim that many people are
now talking about outlawing...
asked 28 minutes ago -
Test the hypothesis using P-value approach. Be sure to verify
the requirements of the test.
H0:...
asked 1 hour ago -
For a voltaic cell based on the reaction below, which statement
is correct?
Zn(s)+2H+(aq)→Zn2+(aq)+H2(g)
Zn2+(aq) is...
asked 54 minutes ago -
If 20 g of Na2SO4 is reacted with 20 g of
Al(NO3)3 according to the following...
asked 46 minutes ago -
One difference between periodic and perpetual inventory systems
is:
Multiple Choice Cost of goods sold is...
asked 51 minutes ago