Liz Raiborn Inc. has the following financial results for the years 2019 through 2021 for its...
Liz Raiborn Inc. has the following financial results for the years 2019 through 2021 for its three regional divisions:
| 2019 | 2020 | 2021 | |||||||
| Revenue | |||||||||
| Southwest | $ | 14,600 | $ | 21,700 | $ | 25,700 | |||
| Midwest | 6,400 | 6,700 | 6,900 | ||||||
| Southeast | 12,100 | 12,700 | 13,000 | ||||||
| Total | $ | 33,100 | $ | 41,100 | $ | 45,600 | |||
| Net Operating Income | |||||||||
| Southwest | $ | 800 | $ | 900 | $ | 1,050 | |||
| Midwest | 950 | 1,300 | 1,250 | ||||||
| Southeast | 700 | 900 | 1,300 | ||||||
| Total | $ | 2,450 | $ | 3,100 | $ | 3,600 | |||
| Average Total Assets | |||||||||
| Southwest | $ | 13,700 | $ | 13,900 | $ | 16,500 | |||
| Midwest | 4,400 | 3,900 | 3,900 | ||||||
| Southeast | 5,000 | 5,300 | 5,300 | ||||||
| Total | $ | 23,100 | $ | 23,100 | $ | 25,700 | |||
Required:
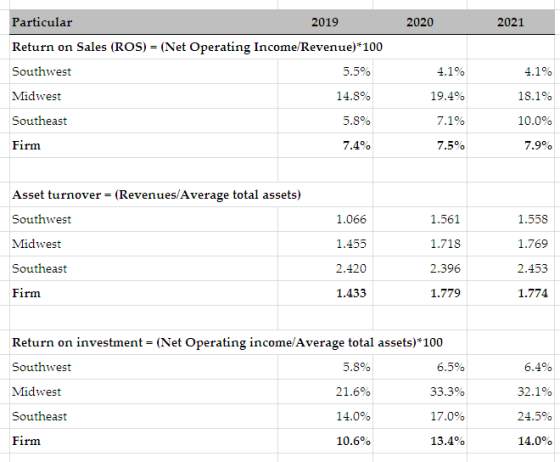
Calculate return on sales (ROS), asset turnover (AT), and return on investment (ROI) for each division and also for the firm as a whole for each of the three years 2019, 2020, and 2021. (Note: Due to rounding your percentages, the totals for the firm might not be the actual total of the individual divisions.) (Round "Asset turnover (AT)" answers to 3 decimal places and other answers to 1 decimal place.)
2019 2020 2021
Return on Sales (ROS)
Southwest % % %
Midwest % % %
Southeast % % %
Firm % % %
Asset turnover
Southwest
Midwest
Southeast
Firm
Return on Investment (ROI)
Southwest % % %
Midwest % % %
Southeast % % %
Firm % % %
Homework Answers
Add Answer to:
Liz Raiborn Inc. has the following financial results for the
years 2019 through 2021 for its...
The following financial information is for Sunland Company. Sunland Company Balance Sheets December 31 2020 2019...
 The following financial information is for Sunland Company. Sunland Company Balance Sheets December 31 2020 2019 ssets Cash Debt investments (short-term) Accounts receivable Inventory Prepaid expenses Land Building and equipment (net) Total assets Liabilities and Stockholders' Equity Notes payable Accounts payable Accrued liabilities Bonds payable, due 2023 Common stock, $10 par Retained earnings Total liabilities and stockholders' equity $ 70,000 65,000 40,000 90,000 237,000 168,000 27,000 134,000 134,000 263,000 186,000 $891,000 $710,000 51,000 109,000 27,000 $169,000 $104,000 53,000 39,000 250,000...
Eagle Sports Supply has the following financial statements. Assume that Eagle’s assets are proportional to its...
 Eagle Sports Supply has the following financial statements.
Assume that Eagle’s assets are proportional to its sales.
INCOME STATEMENT, 2019
Sales
$
1,500
Costs
290
Interest
30
Taxes
240
Net income
$
940
BALANCE SHEET, YEAR-END
2018
2019
2018
2019
Assets
$
3,900
$
4,200
Debt
$
1,200
$
1,300
Equity
2,700
2,900
Total
$
3,900
$
4,200
Total
$
3,900
$
4,200
a. Find Eagle’s required external funds if it
maintains a dividend payout ratio of 50% and plans...
Eagle Sports Supply has the following financial statements.
Assume that Eagle’s assets are proportional to its sales.
INCOME STATEMENT, 2019
Sales
$
1,500
Costs
290
Interest
30
Taxes
240
Net income
$
940
BALANCE SHEET, YEAR-END
2018
2019
2018
2019
Assets
$
3,900
$
4,200
Debt
$
1,200
$
1,300
Equity
2,700
2,900
Total
$
3,900
$
4,200
Total
$
3,900
$
4,200
a. Find Eagle’s required external funds if it
maintains a dividend payout ratio of 50% and plans...
The following financial information is for Cullumber Company Cullumber Company Balance Sheets December 31 2020 2019...
 The following financial information is for Cullumber Company Cullumber Company Balance Sheets December 31 2020 2019 ASsels $ 70,000 $ 64,000 Cash Debt investments (short-term) 39,000 53,000 90,000 Accounts receivable 108,000 162,000 229,000 Inventory Prepaid expenses 25,000 30,000 130,000 Land 130,000 185,000 264,000 Building and equipment (net) $884,000 $695,000 Total assets Liabilities and Stockholders' Equity $172,000 $102,000 Notes payable 65,000 51,000 Accounts payable 41,000 41,000 Accrued liabilities 250,000 172,000 Bonds payable, due 2023 202,000 Common stock, $10 par 202,000 127,000...
 The following financial information is for Sunland Company. Sunland Company Balance Sheets December 31 2020 2019 ssets Cash Debt investments (short-term) Accounts receivable Inventory Prepaid expenses Land Building and equipment (net) Total assets Liabilities and Stockholders' Equity Notes payable Accounts payable Accrued liabilities Bonds payable, due 2023 Common stock, $10 par Retained earnings Total liabilities and stockholders' equity $ 70,000 65,000 40,000 90,000 237,000 168,000 27,000 134,000 134,000 263,000 186,000 $891,000 $710,000 51,000 109,000 27,000 $169,000 $104,000 53,000 39,000 250,000...
 Eagle Sports Supply has the following financial statements.
Assume that Eagle’s assets are proportional to its sales.
INCOME STATEMENT, 2019
Sales
$
1,500
Costs
290
Interest
30
Taxes
240
Net income
$
940
BALANCE SHEET, YEAR-END
2018
2019
2018
2019
Assets
$
3,900
$
4,200
Debt
$
1,200
$
1,300
Equity
2,700
2,900
Total
$
3,900
$
4,200
Total
$
3,900
$
4,200
a. Find Eagle’s required external funds if it
maintains a dividend payout ratio of 50% and plans...
Eagle Sports Supply has the following financial statements.
Assume that Eagle’s assets are proportional to its sales.
INCOME STATEMENT, 2019
Sales
$
1,500
Costs
290
Interest
30
Taxes
240
Net income
$
940
BALANCE SHEET, YEAR-END
2018
2019
2018
2019
Assets
$
3,900
$
4,200
Debt
$
1,200
$
1,300
Equity
2,700
2,900
Total
$
3,900
$
4,200
Total
$
3,900
$
4,200
a. Find Eagle’s required external funds if it
maintains a dividend payout ratio of 50% and plans...
 The following financial information is for Cullumber Company Cullumber Company Balance Sheets December 31 2020 2019 ASsels $ 70,000 $ 64,000 Cash Debt investments (short-term) 39,000 53,000 90,000 Accounts receivable 108,000 162,000 229,000 Inventory Prepaid expenses 25,000 30,000 130,000 Land 130,000 185,000 264,000 Building and equipment (net) $884,000 $695,000 Total assets Liabilities and Stockholders' Equity $172,000 $102,000 Notes payable 65,000 51,000 Accounts payable 41,000 41,000 Accrued liabilities 250,000 172,000 Bonds payable, due 2023 202,000 Common stock, $10 par 202,000 127,000...
Most questions answered within 3 hours.
-
Write a c/c++ program to read a list of students from a file and
create a...
asked 1 minute ago -
Identify two different methods for collecting data in
qualitative research. What are the benefits and challenges...
asked 2 minutes ago -
I am suppose to have my array before the main class but I am
getting the...
asked 4 minutes ago -
Your task is to design the page table for the 32bit Pentium
microprocessor. Answer the following...
asked 10 minutes ago -
The Paradise Shoes Company has estimated its weekly TVC function
from data collected over the past...
asked 9 minutes ago -
A researcher wishes to study the cumulative effects of several
combinations of HIV drugs. There are...
asked 9 minutes ago -
Although Epicurus advocates pursuing pleasure for the
good life, discuss a few reasons why he does...
asked 26 minutes ago -
Problem 1: Present entries to record the selected transactions
described below:
(a)
Issued $2,790,000 of 5-year,...
asked 33 minutes ago -
Using technology to support HR activities increases:
a.
the efficiency of the administrative HR functions.
b....
asked 33 minutes ago -
1. List the features used to classify leaf
types.
2. List some characteristics that are shared...
asked 39 minutes ago -
The three elements of Value Proposition, Key Customers, and
Capabilities operate within an environment. Which of...
asked 41 minutes ago -
Katelynn, a physician, earns $200,000 from her medical practice
in the current year. She receives $45,000...
asked 48 minutes ago