
Homework Answers

Add Answer to:
Average 4-2 The spreadsheet below contains the total returns for the S&P 500 Index for the...
all one question please help with all Problem #1: Geometric Mean Returns Here are the total...
 all one question please help with all
Problem #1: Geometric Mean Returns Here are the total returns for the S&P500 for the first ten years of this century. Year Return 2001 -11.85 % -21.97 % 2002 2003 28.36% 2004 10.74% 2005 4.83% 2006 15.61% 2007 5.48% 2008 -36.55% 2009 26.94% 18.00 % 2010 1. If you invested one dollar on January 1, 2001 in the S&eP500, how much would it be worth ten years later? on January 1, 2011. It...
all one question please help with all
Problem #1: Geometric Mean Returns Here are the total returns for the S&P500 for the first ten years of this century. Year Return 2001 -11.85 % -21.97 % 2002 2003 28.36% 2004 10.74% 2005 4.83% 2006 15.61% 2007 5.48% 2008 -36.55% 2009 26.94% 18.00 % 2010 1. If you invested one dollar on January 1, 2001 in the S&eP500, how much would it be worth ten years later? on January 1, 2011. It...
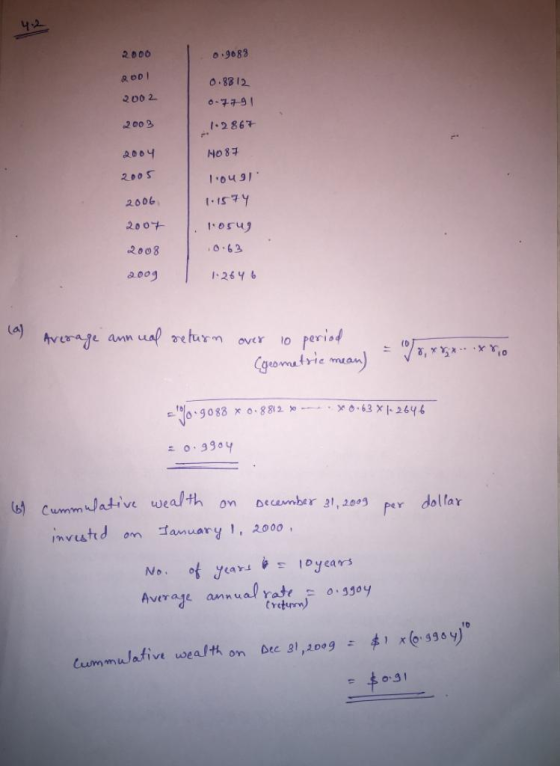
Consider the following realized annual returns: Year Stock A Index 2000 23.6% 50.3% 2001 24.7% 30.7%...
Consider the following realized annual returns: Year Stock A Index 2000 23.6% 50.3% 2001 24.7% 30.7% 2002 30.5% 86.9% 2003 9.0% 23.1% 2004 -2.0% 0.2% 2005 -17.3% -3.2% 2006 -24.3% -27.0% 2007 32.2% 27.9% 2008 4.4% -5.1% 2009 7.4% -11.3% a. Calculate the average of annual returns of the index. b. Compute the standard deviation of annual returns of the index. c. Compute the lower bound of the 95% confidence interval for annual returns of the index. Use the exact...
Question7Task 19 v2 Consider the following realized annual returns: Year Stock A Index 2000 23.6% 47.3%...
Question7Task 19 v2 Consider the following realized annual returns: Year Stock A Index 2000 23.6% 47.3% 2001 24.7% 27.7% 2002 30.5% 86.9% 2003 9.0% 23.1% 2004 -2.0% 0.2% 2005 -17.3% -3.2% 2006 -24.3% -27.0% 2007 32.2% 27.9% 2008 4.4% -5.1% 2009 7.4% -11.3% a. Calculate the average of annual returns of the index. b. Compute the standard deviation of annual returns of the index. c. Compute the lower bound of the 95% confidence interval for annual returns of the index....
The following table shows the annualized return of S&P total return index from 1999 to 2003:...
The following table shows the annualized return of S&P total return index from 1999 to 2003: Year Total Return (%) 1999 21.0 2000 -9.1 2001 -11.9 2002 -22.1 2003 28.7 (a) Calculate the geometric return from 1999 to 2003. (b) Calculate the mean absolute deviation and the sample standard deviation of the index return. (c) Calculate the 45th-percentile of the index return. (d) Sketch the drawdown curve. What is the maximum drawdown of the index return over this period? (e)...
Realized Return for the S&P 500, Microsoft, and Treasury Bills, 2002-2014 S&P 500 Index Dividends Paid...
 Realized Return for the S&P 500, Microsoft, and Treasury Bills, 2002-2014 S&P 500 Index Dividends Paid S&P 500 Realized Return Microsoft Realized Return 1-Month T-Bill Return Year End 2001 2002 2003 2004 2005 2006 2007 2008 2009 2010 2011 2012 2013 2014 1148.08 879.82 1111.92 1211.92 1248.29 418.30 1468.36 903.25 1115.10 1257.64 1257.60 1426.19 1848.36 2058.90 20.80 20.98 23.15 -22.1% 28.7% 109% -22 0% 6.8% 89% 15.8% 5.5% -37.0% 26 5% 158% 20.8% -44.4% 60 5% -65% -4.5% 4.8% 47%...
Use the data in the following table: Year End S&P 500 Index Dividends Paid* S&P 500...
 Use the data in the following table: Year End S&P 500 Index
Dividends Paid* S&P 500 Realized Return Microsoft Realized
Return 1-Month T-Bill Return 2004 1211.92 2005 1248.29 23.15 4.90%
-0.90% 3.00% 2006 1418.3 27.16 15.80% 15.80% 4.80% 2007 1468.36
27.86 5.50% 20.80% 4.70% 2008 903.25 21.85 -37.00% -44.40% 1.50%
2009 1115.1 27.19 26.50% 60.50% 0.10% 2010 1257.64 25.44 15.10%
-6.50% 0.10% 2011 1257.61 26.59 2.10% -4.50% 0.00% 2012 1426.19
32.67 16.00% 5.80% 0.10% 2013 1848.36 39.75 32.40% 44.30% 0.00%...
Use the data in the following table: Year End S&P 500 Index
Dividends Paid* S&P 500 Realized Return Microsoft Realized
Return 1-Month T-Bill Return 2004 1211.92 2005 1248.29 23.15 4.90%
-0.90% 3.00% 2006 1418.3 27.16 15.80% 15.80% 4.80% 2007 1468.36
27.86 5.50% 20.80% 4.70% 2008 903.25 21.85 -37.00% -44.40% 1.50%
2009 1115.1 27.19 26.50% 60.50% 0.10% 2010 1257.64 25.44 15.10%
-6.50% 0.10% 2011 1257.61 26.59 2.10% -4.50% 0.00% 2012 1426.19
32.67 16.00% 5.80% 0.10% 2013 1848.36 39.75 32.40% 44.30% 0.00%...
Use this information for Q14 and Q15 Consider the following realized annual returns: Year-end 1996 1997...
 Use this information for Q14 and Q15 Consider the following realized annual returns: Year-end 1996 1997 1998 1999 2000 2001 2002 2003 2004 2005 S&P 500 Realized Return 23.6% 24.7% 30.5% 9.0% -2.0% -17.3% -24.3% 32.2% 4.4% 7.4% IBM Realized Return 46.3% 26.7% 86.9% 23.1% 0.2% -3.2% -27.0% 27.9% -5.1% -11.3% 14) The average annual return on the S&P 500 from 1996 to 2005 is closest to: A) 8.75% B) 4.00% C) 7.10% D) 9.75% E) 5.85%
Using the data in the table a. What was the average annual return of Microsoft stock...
 Using the data in the table a. What was the average annual return of Microsoft stock from 2002-2014? b. What was the annual volatility for Microsoft stock from 2002-2014? Data Table Realized Return for the S&P 500, Microsoft, and Treasury Bills, 2002-2014 Microsoft S&P 500 Dividends S&P 500 Realized 1-Month Realized Return T-Bill Return Year End Index Paid* Return 2001 1148.08 - 22.1% 2002 879.82 14.53 22.0% 1.6% 2003 1111.92 20.80 28.7% 6.8% 1.0% 2004 20.98 10.9% 8.9% 1211.92 1.2%...
Using the Consumer Price Index (CPI) detailed in the table below, Year CPI CPI Year 2003...
 Using the Consumer Price Index (CPI) detailed in the table below, Year CPI CPI Year 2003 1989 1990 1991 1992 1993 1994 1995 124.0 130.7 136.2 140.3 144.5 148.2 152.4 156.9 160.5 163.0 2004 2005 2006 2007 2008 2009 2010 184.0 188.9 195.3 201.6 207.3 215.3 214.5 218.1 224.9 229.6 233.0 236.7 237.0 240.0 1996 1997 1998 1999 2000 2011 2012 2013 2014 166.6 172.2 177.1 179.7 2001 2002 2015 2016 Instructions: Enter your responses rounded to one decimal place...
The table and graph below relates the amount of coffee that the average American consumed with...
 The table and graph below relates the amount of coffee that the average American consumed with the number of people in the US killed by misusing a lawnmower for each year from 2000 to 2009. (Source Gallons of coffee 421 387 Lawnmower deaths 27 45 378 53 Year 2000 2001 2002 2003 2004 2005 2006 2007 2008 2009 61 388 395 388 391 393 57 388 59 43 84 373 Lawnmower Deaths and Coffee Consumption Deaths (US) 380 380 30...
 all one question please help with all
Problem #1: Geometric Mean Returns Here are the total returns for the S&P500 for the first ten years of this century. Year Return 2001 -11.85 % -21.97 % 2002 2003 28.36% 2004 10.74% 2005 4.83% 2006 15.61% 2007 5.48% 2008 -36.55% 2009 26.94% 18.00 % 2010 1. If you invested one dollar on January 1, 2001 in the S&eP500, how much would it be worth ten years later? on January 1, 2011. It...
all one question please help with all
Problem #1: Geometric Mean Returns Here are the total returns for the S&P500 for the first ten years of this century. Year Return 2001 -11.85 % -21.97 % 2002 2003 28.36% 2004 10.74% 2005 4.83% 2006 15.61% 2007 5.48% 2008 -36.55% 2009 26.94% 18.00 % 2010 1. If you invested one dollar on January 1, 2001 in the S&eP500, how much would it be worth ten years later? on January 1, 2011. It...
 Realized Return for the S&P 500, Microsoft, and Treasury Bills, 2002-2014 S&P 500 Index Dividends Paid S&P 500 Realized Return Microsoft Realized Return 1-Month T-Bill Return Year End 2001 2002 2003 2004 2005 2006 2007 2008 2009 2010 2011 2012 2013 2014 1148.08 879.82 1111.92 1211.92 1248.29 418.30 1468.36 903.25 1115.10 1257.64 1257.60 1426.19 1848.36 2058.90 20.80 20.98 23.15 -22.1% 28.7% 109% -22 0% 6.8% 89% 15.8% 5.5% -37.0% 26 5% 158% 20.8% -44.4% 60 5% -65% -4.5% 4.8% 47%...
 Use the data in the following table: Year End S&P 500 Index
Dividends Paid* S&P 500 Realized Return Microsoft Realized
Return 1-Month T-Bill Return 2004 1211.92 2005 1248.29 23.15 4.90%
-0.90% 3.00% 2006 1418.3 27.16 15.80% 15.80% 4.80% 2007 1468.36
27.86 5.50% 20.80% 4.70% 2008 903.25 21.85 -37.00% -44.40% 1.50%
2009 1115.1 27.19 26.50% 60.50% 0.10% 2010 1257.64 25.44 15.10%
-6.50% 0.10% 2011 1257.61 26.59 2.10% -4.50% 0.00% 2012 1426.19
32.67 16.00% 5.80% 0.10% 2013 1848.36 39.75 32.40% 44.30% 0.00%...
Use the data in the following table: Year End S&P 500 Index
Dividends Paid* S&P 500 Realized Return Microsoft Realized
Return 1-Month T-Bill Return 2004 1211.92 2005 1248.29 23.15 4.90%
-0.90% 3.00% 2006 1418.3 27.16 15.80% 15.80% 4.80% 2007 1468.36
27.86 5.50% 20.80% 4.70% 2008 903.25 21.85 -37.00% -44.40% 1.50%
2009 1115.1 27.19 26.50% 60.50% 0.10% 2010 1257.64 25.44 15.10%
-6.50% 0.10% 2011 1257.61 26.59 2.10% -4.50% 0.00% 2012 1426.19
32.67 16.00% 5.80% 0.10% 2013 1848.36 39.75 32.40% 44.30% 0.00%...
 Use this information for Q14 and Q15 Consider the following realized annual returns: Year-end 1996 1997 1998 1999 2000 2001 2002 2003 2004 2005 S&P 500 Realized Return 23.6% 24.7% 30.5% 9.0% -2.0% -17.3% -24.3% 32.2% 4.4% 7.4% IBM Realized Return 46.3% 26.7% 86.9% 23.1% 0.2% -3.2% -27.0% 27.9% -5.1% -11.3% 14) The average annual return on the S&P 500 from 1996 to 2005 is closest to: A) 8.75% B) 4.00% C) 7.10% D) 9.75% E) 5.85%
 Using the data in the table a. What was the average annual return of Microsoft stock from 2002-2014? b. What was the annual volatility for Microsoft stock from 2002-2014? Data Table Realized Return for the S&P 500, Microsoft, and Treasury Bills, 2002-2014 Microsoft S&P 500 Dividends S&P 500 Realized 1-Month Realized Return T-Bill Return Year End Index Paid* Return 2001 1148.08 - 22.1% 2002 879.82 14.53 22.0% 1.6% 2003 1111.92 20.80 28.7% 6.8% 1.0% 2004 20.98 10.9% 8.9% 1211.92 1.2%...
 Using the Consumer Price Index (CPI) detailed in the table below, Year CPI CPI Year 2003 1989 1990 1991 1992 1993 1994 1995 124.0 130.7 136.2 140.3 144.5 148.2 152.4 156.9 160.5 163.0 2004 2005 2006 2007 2008 2009 2010 184.0 188.9 195.3 201.6 207.3 215.3 214.5 218.1 224.9 229.6 233.0 236.7 237.0 240.0 1996 1997 1998 1999 2000 2011 2012 2013 2014 166.6 172.2 177.1 179.7 2001 2002 2015 2016 Instructions: Enter your responses rounded to one decimal place...
 The table and graph below relates the amount of coffee that the average American consumed with the number of people in the US killed by misusing a lawnmower for each year from 2000 to 2009. (Source Gallons of coffee 421 387 Lawnmower deaths 27 45 378 53 Year 2000 2001 2002 2003 2004 2005 2006 2007 2008 2009 61 388 395 388 391 393 57 388 59 43 84 373 Lawnmower Deaths and Coffee Consumption Deaths (US) 380 380 30...
Most questions answered within 3 hours.
-
Assume one of your finals has 50 questions on it, and
lucky for you, it's all...
asked 17 minutes ago -
Rice Products in Bangladesh
Business behavior is derived in large part from the basic cultural
environment...
asked 1 hour ago -
The following base sequence is found for a mRNA fragment from
wild-type E. coli: 5'- UAUCAGUAGAUAAUGUAACC-3'...
asked 2 hours ago -
For this exercise, round all regression parameters to three
decimal places.
One of the two tables...
asked 2 hours ago -
What is the 5% level of significance for mean = 3.60, standard
deviation = 0.94, and...
asked 2 hours ago -
Prior to beginning work on this discussion, please read the
article by Hayley Peterson, 15 Companies...
asked 2 hours ago -
Which pair of aqueous solutions, when mixed, will form a
precipitate?
A) NaNO3 and AgC2H3O2
B)...
asked 3 hours ago -
1-Write an algorithm to get two numbers from the user (as
inputs) and calculate the sum...
asked 6 hours ago -
Define white-collar crime. What is the difference between
offender and offense-based definitions of white-collar crime? What...
asked 7 hours ago -
Consider a reaction which is 1st order with respect to A and 1st
order with respect...
asked 7 hours ago -
c++
The length of the hypotenuse of a right-angled triangle is the
square root of the...
asked 7 hours ago -
When a metal rod is heated, not only its resistance but also its
length and cross‐sectional...
asked 7 hours ago