
Homework Answers
37)
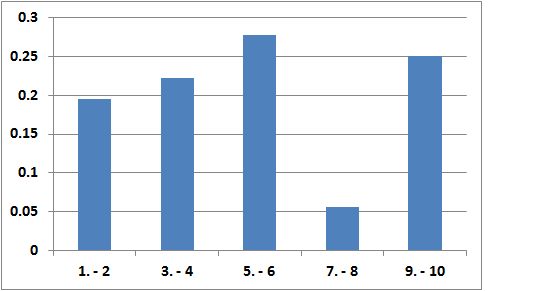
| Class | Frequency | Relative frequency | ||
| 1. - 2 | 7 | 0.194 | ||
| 3. - 4 | 8 | 0.222 | ||
| 5. - 6 | 10 | 0.278 | ||
| 7. - 8 | 2 | 0.056 | ||
| 9. - 10 | 9 | 0.25 | ||
| Total | 36 | 1 | ||
Relative frequency histogram
Add Answer to:
#37
SECTION 2.1 Frequency Distributions and Their Graphs 53 Constructing a Frequency Distribution and a Relative...
Construct a frequency distribution and a relative frequency histogram for the data set using five classes....
 Construct a frequency distribution and a relative frequency histogram for the data set using five classes. Which class has the greatest relative frequency and which has the least relative frequency? Ratings from 1 flowest) to 10 Thighest) from 36 taste testers 2 94 10 10 6 9 55 8 7 5 6 9 4 10 4 3 5 3 5 6 1 3 10 2 7 3 3 6 5 1 0 4 1 Construct a Sequency distribution for the...
HomeworK: 2.1 HW Score: 0 of 1 pt 2.1.37 Save 10 of 10 (9 complete) HW...
 HomeworK: 2.1 HW Score: 0 of 1 pt 2.1.37 Save 10 of 10 (9 complete) HW Score: 90%, 9 of 10 pts Question Help Ratings from 1 (lowest) to 10 highest) from 36 taste testers 1 6 10 1 9 9 5 10 5 7 7 5 6 10 1 4 9 3 4 5 4 56 1 4 9 2 10 3 4 6 6 10 4 2 Construct a frequency distribution and a relative frequency histogram for the...
USING AND INTERPRETING CONCEPTS Constructing a Frequency Distribution In Exercises 29 and 30, construct a frequency...
 USING AND INTERPRETING CONCEPTS Constructing a Frequency Distribution In Exercises 29 and 30, construct a frequency distribution for the data set using the indicated number of classes. In the table, include the midpoints, relative frequencies, and cumulative frequencies Which class has the greatest frequency and which has the least frequency? 9 29, Political Blog Reading Times Number of classes: 5 Data set: Times (in minutes) spent reading a political blog in a day 7 39 13 9 25 8 22...
1.Construct a frequency distribution for the hybrid cars with a class width of 2. 2.Explain why...
 1.Construct a frequency distribution for the hybrid cars with a
class width of 2.
2.Explain why a class width of 2 is too narrow for these
data.
3.Construct a relative frequency distribution for the hybrid
cars with a class width of 3, where the first class has a lower
limit of 20.
4.Construct a histogram based on this relative frequency
distribution. Is the histogram unimodal or bimodal? Describe the
skewness, if any, in these data.
5.Construct a frequency distribution for...
1.Construct a frequency distribution for the hybrid cars with a
class width of 2.
2.Explain why a class width of 2 is too narrow for these
data.
3.Construct a relative frequency distribution for the hybrid
cars with a class width of 3, where the first class has a lower
limit of 20.
4.Construct a histogram based on this relative frequency
distribution. Is the histogram unimodal or bimodal? Describe the
skewness, if any, in these data.
5.Construct a frequency distribution for...
Constructing a frequency distribution and a frequency histogram
In exercise 32 construct a frequency distribution and a frequency histogram for the data set using the indicated number of class. Describe any patterns.Number of classes:5Data set: pungencies( in thousands of Scoville units) of 24 Tabasco peppers35 51 44 42 37 38 36 39 44 43 40 40 32 39 41 38 42 39 40 46 37 35 41 39
for Question 10 make frequency distribution only. Thank you 9. The numbers below are the number...
 for Question 10 make frequency
distribution only.
Thank you
9. The numbers below are the number of aggres sive acts for each preschool child over a week in a class of 25 students. First, construct a fre- quency distribution in the manner of Table 2-9, including the real limits, size, and midpoints of the class intervals. For such a small distribu- tion only five or so intervals are necessary. Sec- ond, compose a relative frequency, cumulative frequency, and cumulative relative...
for Question 10 make frequency
distribution only.
Thank you
9. The numbers below are the number of aggres sive acts for each preschool child over a week in a class of 25 students. First, construct a fre- quency distribution in the manner of Table 2-9, including the real limits, size, and midpoints of the class intervals. For such a small distribu- tion only five or so intervals are necessary. Sec- ond, compose a relative frequency, cumulative frequency, and cumulative relative...
1.Construct a frequency distribution for the hybrid cars with a class width of 2. 2.Explain why...
 1.Construct a frequency distribution for the hybrid cars with a
class width of 2.
2.Explain why a class width of 2 is too narrow for these
data.
3.Construct a relative frequency distribution for the hybrid
cars with a class width of 3, where the first class has a lower
limit of 20.
4.Construct a histogram based on this relative frequency
distribution. Is the histogram unimodal or bimodal? Describe the
skewness, if any, in these data.
Mileage Ratings for 2016 Small...
1.Construct a frequency distribution for the hybrid cars with a
class width of 2.
2.Explain why a class width of 2 is too narrow for these
data.
3.Construct a relative frequency distribution for the hybrid
cars with a class width of 3, where the first class has a lower
limit of 20.
4.Construct a histogram based on this relative frequency
distribution. Is the histogram unimodal or bimodal? Describe the
skewness, if any, in these data.
Mileage Ratings for 2016 Small...
#31 52 CHAPTER 2 Descriptive Statistics Constructing a Frequency Distribution and a Frequency Hist In Exercises...
 #31
52 CHAPTER 2 Descriptive Statistics Constructing a Frequency Distribution and a Frequency Hist In Exercises 31-34, construct a frequency distribution and a frequenc stog for the data set using the indicated number of classes. Describe an Sto ency h .Nuber of lses ola) fo 21 sales representatives a 31. Sales Data set: July sales (in dollars) for 21 sales representatives at a company 2114 2468 7119 1876 4105 3183 1932 355 4278 2000 1077 5835 1512 1697 2478 3981...
#31
52 CHAPTER 2 Descriptive Statistics Constructing a Frequency Distribution and a Frequency Hist In Exercises 31-34, construct a frequency distribution and a frequenc stog for the data set using the indicated number of classes. Describe an Sto ency h .Nuber of lses ola) fo 21 sales representatives a 31. Sales Data set: July sales (in dollars) for 21 sales representatives at a company 2114 2468 7119 1876 4105 3183 1932 355 4278 2000 1077 5835 1512 1697 2478 3981...
Construct a frequency distribution and a relative frequency histogram for the data set using five classes. Which class...
 Construct a frequency distribution and a relative frequency histogram for the data set using five classes. Which class has the greatest relative frequency and which has the least relative frequency? Click the icon to view the data set. Data Table Complete the table below. Use the minimum data entry as the lower limit of the first class Frequency, f Retirement ages for a sample of doctors. 52 66 70 5364 60 70 66 69 61 52 71 5860 73 67...
In Exercises 1 and 2, use the data set, which represents the overall average class sizes...
In Exercises 1 and 2, use the data set, which represents the overall average class sizes for 20 national universities. (Adapted from Public University Honors) 37 34 42 44 39 40 41 51 49 31 55 26 31 40 30 27 36 43 49 35 1. Construct a frequency distribution for the data set using five classes. Include class limits, midpoints, boundaries, frequencies, relative frequencies, and cumulative frequencies. 2. Construct a relative frequency histogram using the frequency distribution in Exercise...
 Construct a frequency distribution and a relative frequency histogram for the data set using five classes. Which class has the greatest relative frequency and which has the least relative frequency? Ratings from 1 flowest) to 10 Thighest) from 36 taste testers 2 94 10 10 6 9 55 8 7 5 6 9 4 10 4 3 5 3 5 6 1 3 10 2 7 3 3 6 5 1 0 4 1 Construct a Sequency distribution for the...
 HomeworK: 2.1 HW Score: 0 of 1 pt 2.1.37 Save 10 of 10 (9 complete) HW Score: 90%, 9 of 10 pts Question Help Ratings from 1 (lowest) to 10 highest) from 36 taste testers 1 6 10 1 9 9 5 10 5 7 7 5 6 10 1 4 9 3 4 5 4 56 1 4 9 2 10 3 4 6 6 10 4 2 Construct a frequency distribution and a relative frequency histogram for the...
 USING AND INTERPRETING CONCEPTS Constructing a Frequency Distribution In Exercises 29 and 30, construct a frequency distribution for the data set using the indicated number of classes. In the table, include the midpoints, relative frequencies, and cumulative frequencies Which class has the greatest frequency and which has the least frequency? 9 29, Political Blog Reading Times Number of classes: 5 Data set: Times (in minutes) spent reading a political blog in a day 7 39 13 9 25 8 22...
 1.Construct a frequency distribution for the hybrid cars with a
class width of 2.
2.Explain why a class width of 2 is too narrow for these
data.
3.Construct a relative frequency distribution for the hybrid
cars with a class width of 3, where the first class has a lower
limit of 20.
4.Construct a histogram based on this relative frequency
distribution. Is the histogram unimodal or bimodal? Describe the
skewness, if any, in these data.
5.Construct a frequency distribution for...
1.Construct a frequency distribution for the hybrid cars with a
class width of 2.
2.Explain why a class width of 2 is too narrow for these
data.
3.Construct a relative frequency distribution for the hybrid
cars with a class width of 3, where the first class has a lower
limit of 20.
4.Construct a histogram based on this relative frequency
distribution. Is the histogram unimodal or bimodal? Describe the
skewness, if any, in these data.
5.Construct a frequency distribution for...
 for Question 10 make frequency
distribution only.
Thank you
9. The numbers below are the number of aggres sive acts for each preschool child over a week in a class of 25 students. First, construct a fre- quency distribution in the manner of Table 2-9, including the real limits, size, and midpoints of the class intervals. For such a small distribu- tion only five or so intervals are necessary. Sec- ond, compose a relative frequency, cumulative frequency, and cumulative relative...
for Question 10 make frequency
distribution only.
Thank you
9. The numbers below are the number of aggres sive acts for each preschool child over a week in a class of 25 students. First, construct a fre- quency distribution in the manner of Table 2-9, including the real limits, size, and midpoints of the class intervals. For such a small distribu- tion only five or so intervals are necessary. Sec- ond, compose a relative frequency, cumulative frequency, and cumulative relative...
 1.Construct a frequency distribution for the hybrid cars with a
class width of 2.
2.Explain why a class width of 2 is too narrow for these
data.
3.Construct a relative frequency distribution for the hybrid
cars with a class width of 3, where the first class has a lower
limit of 20.
4.Construct a histogram based on this relative frequency
distribution. Is the histogram unimodal or bimodal? Describe the
skewness, if any, in these data.
Mileage Ratings for 2016 Small...
1.Construct a frequency distribution for the hybrid cars with a
class width of 2.
2.Explain why a class width of 2 is too narrow for these
data.
3.Construct a relative frequency distribution for the hybrid
cars with a class width of 3, where the first class has a lower
limit of 20.
4.Construct a histogram based on this relative frequency
distribution. Is the histogram unimodal or bimodal? Describe the
skewness, if any, in these data.
Mileage Ratings for 2016 Small...
 #31
52 CHAPTER 2 Descriptive Statistics Constructing a Frequency Distribution and a Frequency Hist In Exercises 31-34, construct a frequency distribution and a frequenc stog for the data set using the indicated number of classes. Describe an Sto ency h .Nuber of lses ola) fo 21 sales representatives a 31. Sales Data set: July sales (in dollars) for 21 sales representatives at a company 2114 2468 7119 1876 4105 3183 1932 355 4278 2000 1077 5835 1512 1697 2478 3981...
#31
52 CHAPTER 2 Descriptive Statistics Constructing a Frequency Distribution and a Frequency Hist In Exercises 31-34, construct a frequency distribution and a frequenc stog for the data set using the indicated number of classes. Describe an Sto ency h .Nuber of lses ola) fo 21 sales representatives a 31. Sales Data set: July sales (in dollars) for 21 sales representatives at a company 2114 2468 7119 1876 4105 3183 1932 355 4278 2000 1077 5835 1512 1697 2478 3981...
 Construct a frequency distribution and a relative frequency histogram for the data set using five classes. Which class has the greatest relative frequency and which has the least relative frequency? Click the icon to view the data set. Data Table Complete the table below. Use the minimum data entry as the lower limit of the first class Frequency, f Retirement ages for a sample of doctors. 52 66 70 5364 60 70 66 69 61 52 71 5860 73 67...
Most questions answered within 3 hours.
-
D. A student completed 20 courses in the School of Arts and
Sciences. Her grades in...
asked 32 minutes ago -
teo
pucks moving on a frictionless air table are about to collide. the
1.5 kg puck...
asked 37 minutes ago -
Problem #1
The area between Z = 0 and Z = 2.50
The area between Z...
asked 2 hours ago -
1. What is the meaning of the term communication style?
2. What are the benefits to...
asked 1 hour ago -
9.) You are buying a car that cost $26,500. You make payments of
$412 each month...
asked 2 hours ago -
. Suppose a discrete random variable has probability
distribution
P(x) = .2 if x = 0...
asked 3 hours ago -
Under the influence of its drive force, a snowmobile is moving
at a constant velocity along...
asked 3 hours ago -
Why do organizations decline? What steps can top
management take to halt, decline, and restore organizational...
asked 3 hours ago -
What mechanisms Drive speciation??
(I.e. what was Dawins theory on the orgin of species, and how...
asked 5 hours ago -
The manager at a car assembly plant believes that the mean
assembly time for a car...
asked 6 hours ago -
Which of the following is true of electron capture?
A) It decreases the nuclide's mass number...
asked 7 hours ago -
Assuming an efficiency of 43.10%, calculate the actual yield of
magnesium nitrate formed from 114.9 g...
asked 8 hours ago