

please help with these questions thank you!
Homework Answers
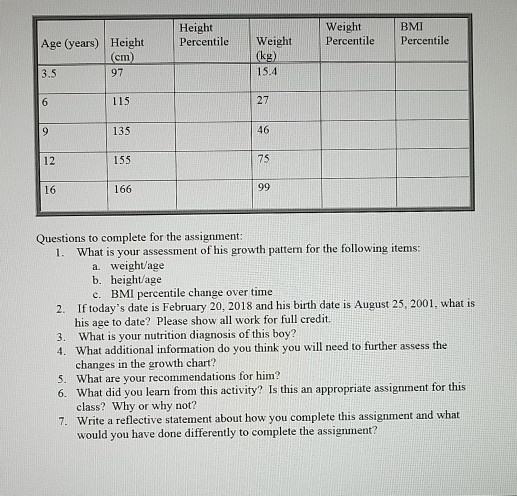
1,a, Weight/age
Age(3.5) -weight (15.4kg) - Normal weight
Age (6)- weight (27)- Overweight
age (9) -Weight (46) - Overweight
Age (12) - weight ( 75) -overweight
Age ( 16) - weight ( 99) - Overweight
2, Height /age
Age ( 3.5) - height (97cm) - Normal
Age ( 6) - height (115cm) -normal
Age (9) - height ( 135cm) - normal
age ( 12) -height (155cm) - normal
Age ( 16 )- height ( 166cm) - normal
c, BMI percentile
Weight Kg divided height 2(m2)( change height into meter)
3. 5 years - 15.4 Divided (0.97 X 0.97)
15.4 divided by 0.94 =16.3 (normal)
6years - 27 divided by 1.15 X 1.15
27 divided by 1.32 = 20.4(overweight)
9 years - 46 divided (1.35X 1.35)
46 divided by 1.82 = 25.2 (overweight )
12 years - 75 divided 1.55 X 1.55
75 divided by 2.4 = 31.2 (overweight )
16 years - 99 divided (1.66 X 1.66)
99 divided by 2.7 = 36.6 (overweight)
2, age calculation
calculate years by 2018 - 2001 = 17 years
Month feb - August = 6months
Present age 17 years 6 months
3, Overweight ..It means that as per his age his weight and body
mass index are high..
4, Additional information we can get through growth chart using the
percentile lines on the chart to assess body size and growth and to
monitor growth overtime..
5, Recommendation:
- Advice for weight reduction program
-advice to control food fatty,processed snacks and meals and sugary
content..
- Weight program include sleep pattern as he is 17 years old his
study pressure will be more..stress affects teens eating behavior
and physical activity..
-Advice to avoid watching television and mobile phone while
eating..
-Advice never skip the meals for any reason
- Advice to do aerobic exercise and cycling,swimming etc which can
reduce the weight....
Add Answer to:
please help with these questions thank you!
Height Weight BMI Age (years) HeightPercentile Weight Percentile Percentile...
6. The graph on the next page is a doctor's chart for calculating body mass index...
 6. The graph on the next page is a doctor's chart for calculating body mass index (BMI) percentiles for girls aged 2 to 20 years (I got this chart from www.cdc.gov/growthcharts/ clinical_charts.htm). The r-axis is age (in years), and the y-axis is BMI (in kg/m2). BMI is calculated as weight divided by height squared. The different curves represent different percentiles, denoted by the small number on the right of each curve. If a girl is in the 95 percentile (top...
Refer to graph- fill in empty boxes Infant 1 Infant 2 Weight Length (kg) (cm) Weight...
 Refer to graph- fill in empty boxes
Infant 1 Infant 2 Weight Length (kg) (cm) Weight Length Weight | Length (kg) Weight Length %ile Age Date Age Date (cm) %ile %ile %ile mo mo 10.4.11 3.15 4.8.1 3.20 49.5 52.1 DOB 1 DOB 61.0 59.0 7.6.1 6.49 1.6.12 5.08 1 10.12 8.30 67.0 6.07 4.4.12 62.7 11 10.11.1 7.55 10.06 71.1 4.11 76.3 12 2 10.5 4.10.13 8.42 76.0 12.76 85.2 12 Birth to 24 months: Girls NAME Length-for-age and...
Refer to graph- fill in empty boxes
Infant 1 Infant 2 Weight Length (kg) (cm) Weight Length Weight | Length (kg) Weight Length %ile Age Date Age Date (cm) %ile %ile %ile mo mo 10.4.11 3.15 4.8.1 3.20 49.5 52.1 DOB 1 DOB 61.0 59.0 7.6.1 6.49 1.6.12 5.08 1 10.12 8.30 67.0 6.07 4.4.12 62.7 11 10.11.1 7.55 10.06 71.1 4.11 76.3 12 2 10.5 4.10.13 8.42 76.0 12.76 85.2 12 Birth to 24 months: Girls NAME Length-for-age and...
2. Jennifer is 3 years old. She has a height-for-age Z-score of -3.1 and a weight-for-height...
 2. Jennifer is 3 years old. She has a height-for-age Z-score of -3.1 and a weight-for-height Z-score of -1.1. (3 points) a. Is she most likelv acutely or chronically malnourished? Explain your answer b. What is one possible cause of her condition? 3. Ryan is 6 months old. He has a length-for-age Z-score of -0.7 and a weight-for-length Z-score of -2.4 (4 points) a. Is he most likely acutely or chronically malnourished? Explain your answer b. What are two possible...
Alan is 45 years of age. His weight and BMI are all ideal for his age....
Alan is 45 years of age. His weight and BMI are all ideal for his age. A year ago he was diagnosed with aggressive prostate cancer, and he elected to be castrated. He weigh his body fat content is normal. Bill is a 24 year old. You are trying to diagnose a genetic mutation that he has. He weighs 178 lbs and his body fat content is normal. His testicular volume is very low for his age. Adrenal gland steroidogenesis...
Observation Education (No. of years) Length of tenure in current employment (No. of years) Age (No....
Observation Education (No. of years) Length of tenure in current employment (No. of years) Age (No. of years) Annual income ($) 1 17 8 40 124,000 2 12 12 41 30,000 3 20 9 44 193,000 4 14 4 42 88,000 5 12 1 22 27,000 6 14 9 28 43,000 7 12 8 43 96,000 8 18 10 37 110,000 9 16 12 36 88,000 10 11 7 39 36,000 11 16 14 42 81,000 12 12 4 23...
plot their weight, height, and BMFfor-age. (30 pon James (male BMI (kg/m2) 16.4 17.8 17.6 19.2...
 plot their weight, height, and BMFfor-age. (30 pon James (male BMI (kg/m2) 16.4 17.8 17.6 19.2 23.1 27.0 WeightHeight Age (cm) 88.3 98.7 105.7 128. 147.6 167 (kg) 12.8 17.3 19.7 31.4 2 75.4 13 Internret the information that you have plotted in the ? b. Describe James height and Heig weight growth trajectories from 2 to 13 years of age. We 6. c. Which trajectory increased more rapidly? (circle one)
The body mass index (BMI) is a measure of relative weight based on height and weight....
The body mass index (BMI) is a measure of relative weight based on height and weight. The body fat percentage (BFP) of a human or other living being is the total mass of fat divided by total body mass, multiplied by 100; body fat includes essential body fat and storage body fat. Essential body fat is necessary to maintain life and reproductive functions. Write a program that calculates and prints the BFP for multiple persons; the program allows user to...
Please write in the answer clear. Will leave like if its correct . Age Gen Sibs Work Exercise Units Mom 18 M 1 20 10 15 6 17 F 3 0 7 15 14 23 M...
 Please write in the answer clear. Will leave like if its
correct
.
Age
Gen
Sibs
Work
Exercise
Units
Mom
18
M
1
20
10
15
6
17
F
3
0
7
15
14
23
M
3
20
5
13
8
20
M
2
0
5
15
16
18
F
4
22
6
16
9
20
F
2
11
7
20
20
34
F
1
48
10
10
18
22
F
3
37
13
13
18
19
M
3
0...
Please write in the answer clear. Will leave like if its
correct
.
Age
Gen
Sibs
Work
Exercise
Units
Mom
18
M
1
20
10
15
6
17
F
3
0
7
15
14
23
M
3
20
5
13
8
20
M
2
0
5
15
16
18
F
4
22
6
16
9
20
F
2
11
7
20
20
34
F
1
48
10
10
18
22
F
3
37
13
13
18
19
M
3
0...
k. Create a Conditional Probabilities Pivot Table (% of column) for ‘Age Group’ and ‘Prefer Scent’, to know the probabil...
k. Create a Conditional Probabilities Pivot Table (% of column) for ‘Age Group’ and ‘Prefer Scent’, to know the probability that a customer will be of a certain group given Yes or No preference for the scent. Create another Conditional Probabilities Table (% of row) for ‘Age Group’ and ‘Prefer Scent’, to know the probability that a customer of a given group will answer Yes or No. TABLE C3-1: Teen Shoppers at ForU21 by Gender, Age, Scent Preference, Purpose of...
Seven-year-old Timothy’s mother takes him to his pediatrician for his annual checkup. His weight is 68...
Seven-year-old Timothy’s mother takes him to his pediatrician for his annual checkup. His weight is 68 pounds (30.91 kg), plotted at the 95th percentile, and his height is 50 inches (127 cm, 1.27 M), between the 75th and 90th percentiles for his age. Timothy is considered sedentary. His body mass index plots at the 95th percentile for his age. His growth percentiles have been increasing over the last several years. Timothy has a cousin Marley. She is also 7 years...
 6. The graph on the next page is a doctor's chart for calculating body mass index (BMI) percentiles for girls aged 2 to 20 years (I got this chart from www.cdc.gov/growthcharts/ clinical_charts.htm). The r-axis is age (in years), and the y-axis is BMI (in kg/m2). BMI is calculated as weight divided by height squared. The different curves represent different percentiles, denoted by the small number on the right of each curve. If a girl is in the 95 percentile (top...
 Refer to graph- fill in empty boxes
Infant 1 Infant 2 Weight Length (kg) (cm) Weight Length Weight | Length (kg) Weight Length %ile Age Date Age Date (cm) %ile %ile %ile mo mo 10.4.11 3.15 4.8.1 3.20 49.5 52.1 DOB 1 DOB 61.0 59.0 7.6.1 6.49 1.6.12 5.08 1 10.12 8.30 67.0 6.07 4.4.12 62.7 11 10.11.1 7.55 10.06 71.1 4.11 76.3 12 2 10.5 4.10.13 8.42 76.0 12.76 85.2 12 Birth to 24 months: Girls NAME Length-for-age and...
Refer to graph- fill in empty boxes
Infant 1 Infant 2 Weight Length (kg) (cm) Weight Length Weight | Length (kg) Weight Length %ile Age Date Age Date (cm) %ile %ile %ile mo mo 10.4.11 3.15 4.8.1 3.20 49.5 52.1 DOB 1 DOB 61.0 59.0 7.6.1 6.49 1.6.12 5.08 1 10.12 8.30 67.0 6.07 4.4.12 62.7 11 10.11.1 7.55 10.06 71.1 4.11 76.3 12 2 10.5 4.10.13 8.42 76.0 12.76 85.2 12 Birth to 24 months: Girls NAME Length-for-age and...
 2. Jennifer is 3 years old. She has a height-for-age Z-score of -3.1 and a weight-for-height Z-score of -1.1. (3 points) a. Is she most likelv acutely or chronically malnourished? Explain your answer b. What is one possible cause of her condition? 3. Ryan is 6 months old. He has a length-for-age Z-score of -0.7 and a weight-for-length Z-score of -2.4 (4 points) a. Is he most likely acutely or chronically malnourished? Explain your answer b. What are two possible...
 plot their weight, height, and BMFfor-age. (30 pon James (male BMI (kg/m2) 16.4 17.8 17.6 19.2 23.1 27.0 WeightHeight Age (cm) 88.3 98.7 105.7 128. 147.6 167 (kg) 12.8 17.3 19.7 31.4 2 75.4 13 Internret the information that you have plotted in the ? b. Describe James height and Heig weight growth trajectories from 2 to 13 years of age. We 6. c. Which trajectory increased more rapidly? (circle one)
 Please write in the answer clear. Will leave like if its
correct
.
Age
Gen
Sibs
Work
Exercise
Units
Mom
18
M
1
20
10
15
6
17
F
3
0
7
15
14
23
M
3
20
5
13
8
20
M
2
0
5
15
16
18
F
4
22
6
16
9
20
F
2
11
7
20
20
34
F
1
48
10
10
18
22
F
3
37
13
13
18
19
M
3
0...
Please write in the answer clear. Will leave like if its
correct
.
Age
Gen
Sibs
Work
Exercise
Units
Mom
18
M
1
20
10
15
6
17
F
3
0
7
15
14
23
M
3
20
5
13
8
20
M
2
0
5
15
16
18
F
4
22
6
16
9
20
F
2
11
7
20
20
34
F
1
48
10
10
18
22
F
3
37
13
13
18
19
M
3
0...
Most questions answered within 3 hours.
-
(63
#14)
which of the following statments best describes how chamging
the concentration of the substances...
asked 2 hours ago -
In the following reaction, which element is undergoing
oxidation: Na2SO3 + N2O --> N2 + Na2SO4...
asked 2 hours ago -
Which of the following pairs of ions have the same electron
configuration?
I: Br− and Se2−...
asked 5 hours ago -
The Foremost Composite Materials Company is planning a two-day
sales conference for October 19-20. The conference...
asked 5 hours ago -
3) Illustrate the observed pattern of relatedness of organisms
versus adaptations to specific conditions. This means...
asked 6 hours ago -
In winter a lake has a 0.35 m thick ice layer over 1.10 m of
water....
asked 7 hours ago -
Assuming the following has been encrypted with a Vigenere cipher
below, use the method(s) and assumptions...
asked 7 hours ago -
How would I use switch statements to write a program that will
take an input of...
asked 7 hours ago -
Imagine a reaction in which methane gas combusts at a constant
pressure of 1 atm and...
asked 7 hours ago -
Two parallel wires (each 12 m in length) are separated by a
distance of 0.065 m...
asked 7 hours ago -
Suppose there were three masses at the corner of uniform
equilateral triangle. The masses are m1...
asked 7 hours ago -
Situation: A building that is 618 m above the ground floor. How
many times would a...
asked 7 hours ago