Answer the following fundamental questions for each time series (exercise 1-10):
i. What is measured? (definition of the time series)
ii. How is it measured? (measurement units)
iii. What is the periodicity? (frequency of the series)
iv. What are the dominant features of the time series? (trends, non-seasonal cycles, seasonal cycles)


Homework Answers
a)
Note :
However Question is not clear properly If you have any doubt on answer please comment
But do not downvote
Time series analysis
is a statistical technique that deals with time series data, or
trend analysis. Time series data means that data is in a series of
particular time periods or intervals. The data is considered in
three types:
Time series data:
A set of observations on the values that a variable takes at
different times.
Cross-sectional data:
Data of one or more variables, collected at the same point in
time.
Pooled data:
A combination of time series data and cross-sectional data.
b)
Measurement units are
Medical Household income
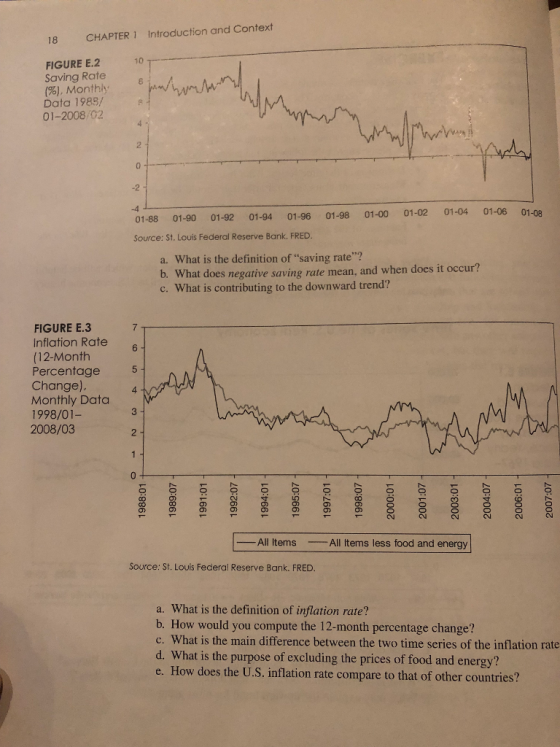
Saving rate
Case shiller home price index
Inflation rate
Mortgage rate
c)
Periodicity
A fundamental characteristic of time series data is how frequently
the observations are spaced in time. How often the observations of
a time series occur is called the sampling frequency or the
periodicity of the series.
For example, a time series with one observation each month has a monthly sampling frequency or monthly periodicity and so is called a monthly time series.
Figure E .1: Frequency/Periodicity is 3 years
Figure E. 2:Frequency/Periodicity is 2 years
Figure E.3 : Frequency is 1.6 years
Figure E.4 frequency is 2 years
Figure E,5 frequency is 1.6 years
Figure E 10: Frequency or periodicity is 6 month
d)
Dominant features of time series here are
Seasonal cycles
Add Answer to:
Answer the following fundamental questions for each time series
(exercise 1-10):
i. What is measured? (definition...
3 of 6 (5 complete) RTDA+: Exchange Rates and Prices Real-time data provided by Federal Reserve Economic Data (FRED...
 3 of 6 (5 complete) RTDA+: Exchange Rates and Prices Real-time data provided by Federal Reserve Economic Data (FRED), Federal Reserve Bank of Saint Louis For each of the following countries, enter the exchange rate for Septermber 06, 2019 (Enter your responses exactly as they appear in FRED.) Title Series ID Value Japan /U.S. Foreign Exchange Rate 106.80 DEXJPUS China/U.S. Foreign Exchange Rate 7.1131 DEXCHUS Mexico /U.S. Foreign Exchange Rate DEXMXUS 19.5575 All of the above exchange rates are quioted...
Intertemporal trade allows economies to: a) always have a trade surplus. b) smooth risk over time....
 Intertemporal trade allows economies to: a) always have a trade surplus. b) smooth risk over time. c) run trade deficits for all periods. d) None of these answers is correct. e) reduce consumption over time. Refer to the following table when answering the following questions. Annual Average Exchange Rates: 2010-2012 $US/ MX Swiss Year $US/Euro £UK Yen/$US Peso/$US$CAN/$US $AUS/$US Franc/$US 2010 1.326 2011 1.393 2012 1.286 1.545 1.604 1.585 87.780 12.624 79.700 12.427 79.820 13.154 1.030 0.989 1.000 0.920 1.033...
Visit a construction site almost anywhere in the world, and odds are that the earthmoving equipme...
 Visit a construction site
almost anywhere in the world, and odds are that the earthmoving
equipment you see -- the tractors, dump trucks, excavators,
graders, scrapers, and so on -- is made by one of the two
companies, America's Caterpillar or Japan's Komatsu. Caterpillar
and Komatsu both rely heavily on exports, rather than selling only
to their domestic markets, and have been fierce competitors for
three decades, with first one company, then the other, seemingly on
the ropes. Ask the...
Visit a construction site
almost anywhere in the world, and odds are that the earthmoving
equipment you see -- the tractors, dump trucks, excavators,
graders, scrapers, and so on -- is made by one of the two
companies, America's Caterpillar or Japan's Komatsu. Caterpillar
and Komatsu both rely heavily on exports, rather than selling only
to their domestic markets, and have been fierce competitors for
three decades, with first one company, then the other, seemingly on
the ropes. Ask the...
4. Inflation and interest rates The following table shows the average nominal interest rates on six-month...
4. Inflation and interest rates The following table shows the average nominal interest rates on six-month Treasury bills between 1997 and 2001, which determined the nominal interest rate that the U.S. government paid when it issued debt in those years. The table also shows the inflation rate for the years 1997 to 2001. (All rates are rounded to the nearest tenth of a percent.) Year Nominal Interest Rate Inflation Rate (Percent) (Percent) 1997 5.2 2.3 1998 4.8 1.5 1999 4.8...
The following table shows the average nominal interest rates on six-month Treasury bills between 1971 and...
 The following table shows the average nominal interest rates on
six-month Treasury bills between 1971 and 1975, which determined
the nominal interest rate that the U.S. government paid when it
issued debt in those years. The table also shows the inflation rate
for the years 1971 to 1975. (All rates are rounded to the nearest
tenth of a percent.)
Year
Nominal Interest Rate
Inflation Rate
(Percent)
(Percent)
1971
4.5
4.2
1972
4.5
3.3
1973
7.2
6.3
1974
8.0
11.0
1975...
The following table shows the average nominal interest rates on
six-month Treasury bills between 1971 and 1975, which determined
the nominal interest rate that the U.S. government paid when it
issued debt in those years. The table also shows the inflation rate
for the years 1971 to 1975. (All rates are rounded to the nearest
tenth of a percent.)
Year
Nominal Interest Rate
Inflation Rate
(Percent)
(Percent)
1971
4.5
4.2
1972
4.5
3.3
1973
7.2
6.3
1974
8.0
11.0
1975...
41 The money supply is a curve that is typically drawn as a vertical line on...
 41 The money supply is a curve that is typically drawn as a vertical line on the standard money supply - money demand graph that is used in the study of monetary policy. We all know the money supply is only controlled by the Federal Reserve Bank. Conclusion: In the audio visual lecture Professor Torres stated that anytime we see a supply curve drawn as a vertical curve line, then that means that the product or service is 100 percent...
18 Congress has the legal right to force the Federal Reserve Bank to accept and carry...
 18 Congress has the legal right to force the Federal Reserve Bank to accept and carry out their suggested recommendations regarding Monetary Policy. 8 03:57:44 True or False True False 19 The Federal Reserve Bank is the chief regulatory agency among all of the financial regulatory agencies like the SEC, FDIC, etc... The Federal Reserve Bank has the most regulatory power. 03:57:40 Multiple Choice This is foise - the US Treasury Department has the most regulatory power in the U.S....
Answer the following questions, in complete sentences, for each data set. (7 points each) Are al...
 Answer the following
questions, in complete sentences, for each
data set. (7 points each)
Are all the required conditions of the regression met?
When there is no advertising, does the company have positive
sales?
Advertising and sales data: 36 consecutive monthly sales and advertising expenditures of a dietary weight control product Exported from datamarket.com Date exported 2014-10-26 21:28 On DataMarket Unknown; please assume a restricted license (all rights reserved); contact DataMarket if you need different licensing Time Series Data Library...
Answer the following
questions, in complete sentences, for each
data set. (7 points each)
Are all the required conditions of the regression met?
When there is no advertising, does the company have positive
sales?
Advertising and sales data: 36 consecutive monthly sales and advertising expenditures of a dietary weight control product Exported from datamarket.com Date exported 2014-10-26 21:28 On DataMarket Unknown; please assume a restricted license (all rights reserved); contact DataMarket if you need different licensing Time Series Data Library...
#13 What is the expected one-year interest rate on a 1-year 1-Bill in four years? 12....
 #13
What is the expected one-year interest rate on a 1-year 1-Bill in four years? 12. YOP, Inc has a 3-year outstanding bond with 13% yield. Investors expect to earn an average of 3% in real rate of return. Inflation is expected to be 1.5%, 2.0% and 4% for the next 3 years. Its lack of popularity in the financial market requires it to pay 2.5% for its lack of liquidity, and its relatively short amount of time before maturity...
#13
What is the expected one-year interest rate on a 1-year 1-Bill in four years? 12. YOP, Inc has a 3-year outstanding bond with 13% yield. Investors expect to earn an average of 3% in real rate of return. Inflation is expected to be 1.5%, 2.0% and 4% for the next 3 years. Its lack of popularity in the financial market requires it to pay 2.5% for its lack of liquidity, and its relatively short amount of time before maturity...
1. Consider two countries, U.S. and Thailand. In 2019, the U.S. experienced an output growth of...
1. Consider two countries, U.S. and Thailand. In 2019, the U.S. experienced an output growth of 2%, whereas Thailand had an output growth of 4.5%. Suppose the U.S. Federal Reserve allowed the money supply to grow by 4.5% each year, whereas the Bank of Thailand chose to maintain relatively high money supply growth of 6% per year. For the following questions, use the simple monetary model. Treat the U.S. as the home country and Thailand as the foreign country. (a)...
 3 of 6 (5 complete) RTDA+: Exchange Rates and Prices Real-time data provided by Federal Reserve Economic Data (FRED), Federal Reserve Bank of Saint Louis For each of the following countries, enter the exchange rate for Septermber 06, 2019 (Enter your responses exactly as they appear in FRED.) Title Series ID Value Japan /U.S. Foreign Exchange Rate 106.80 DEXJPUS China/U.S. Foreign Exchange Rate 7.1131 DEXCHUS Mexico /U.S. Foreign Exchange Rate DEXMXUS 19.5575 All of the above exchange rates are quioted...
 Intertemporal trade allows economies to: a) always have a trade surplus. b) smooth risk over time. c) run trade deficits for all periods. d) None of these answers is correct. e) reduce consumption over time. Refer to the following table when answering the following questions. Annual Average Exchange Rates: 2010-2012 $US/ MX Swiss Year $US/Euro £UK Yen/$US Peso/$US$CAN/$US $AUS/$US Franc/$US 2010 1.326 2011 1.393 2012 1.286 1.545 1.604 1.585 87.780 12.624 79.700 12.427 79.820 13.154 1.030 0.989 1.000 0.920 1.033...
 Visit a construction site
almost anywhere in the world, and odds are that the earthmoving
equipment you see -- the tractors, dump trucks, excavators,
graders, scrapers, and so on -- is made by one of the two
companies, America's Caterpillar or Japan's Komatsu. Caterpillar
and Komatsu both rely heavily on exports, rather than selling only
to their domestic markets, and have been fierce competitors for
three decades, with first one company, then the other, seemingly on
the ropes. Ask the...
Visit a construction site
almost anywhere in the world, and odds are that the earthmoving
equipment you see -- the tractors, dump trucks, excavators,
graders, scrapers, and so on -- is made by one of the two
companies, America's Caterpillar or Japan's Komatsu. Caterpillar
and Komatsu both rely heavily on exports, rather than selling only
to their domestic markets, and have been fierce competitors for
three decades, with first one company, then the other, seemingly on
the ropes. Ask the...
 The following table shows the average nominal interest rates on
six-month Treasury bills between 1971 and 1975, which determined
the nominal interest rate that the U.S. government paid when it
issued debt in those years. The table also shows the inflation rate
for the years 1971 to 1975. (All rates are rounded to the nearest
tenth of a percent.)
Year
Nominal Interest Rate
Inflation Rate
(Percent)
(Percent)
1971
4.5
4.2
1972
4.5
3.3
1973
7.2
6.3
1974
8.0
11.0
1975...
The following table shows the average nominal interest rates on
six-month Treasury bills between 1971 and 1975, which determined
the nominal interest rate that the U.S. government paid when it
issued debt in those years. The table also shows the inflation rate
for the years 1971 to 1975. (All rates are rounded to the nearest
tenth of a percent.)
Year
Nominal Interest Rate
Inflation Rate
(Percent)
(Percent)
1971
4.5
4.2
1972
4.5
3.3
1973
7.2
6.3
1974
8.0
11.0
1975...
 41 The money supply is a curve that is typically drawn as a vertical line on the standard money supply - money demand graph that is used in the study of monetary policy. We all know the money supply is only controlled by the Federal Reserve Bank. Conclusion: In the audio visual lecture Professor Torres stated that anytime we see a supply curve drawn as a vertical curve line, then that means that the product or service is 100 percent...
 18 Congress has the legal right to force the Federal Reserve Bank to accept and carry out their suggested recommendations regarding Monetary Policy. 8 03:57:44 True or False True False 19 The Federal Reserve Bank is the chief regulatory agency among all of the financial regulatory agencies like the SEC, FDIC, etc... The Federal Reserve Bank has the most regulatory power. 03:57:40 Multiple Choice This is foise - the US Treasury Department has the most regulatory power in the U.S....
 Answer the following
questions, in complete sentences, for each
data set. (7 points each)
Are all the required conditions of the regression met?
When there is no advertising, does the company have positive
sales?
Advertising and sales data: 36 consecutive monthly sales and advertising expenditures of a dietary weight control product Exported from datamarket.com Date exported 2014-10-26 21:28 On DataMarket Unknown; please assume a restricted license (all rights reserved); contact DataMarket if you need different licensing Time Series Data Library...
Answer the following
questions, in complete sentences, for each
data set. (7 points each)
Are all the required conditions of the regression met?
When there is no advertising, does the company have positive
sales?
Advertising and sales data: 36 consecutive monthly sales and advertising expenditures of a dietary weight control product Exported from datamarket.com Date exported 2014-10-26 21:28 On DataMarket Unknown; please assume a restricted license (all rights reserved); contact DataMarket if you need different licensing Time Series Data Library...
 #13
What is the expected one-year interest rate on a 1-year 1-Bill in four years? 12. YOP, Inc has a 3-year outstanding bond with 13% yield. Investors expect to earn an average of 3% in real rate of return. Inflation is expected to be 1.5%, 2.0% and 4% for the next 3 years. Its lack of popularity in the financial market requires it to pay 2.5% for its lack of liquidity, and its relatively short amount of time before maturity...
#13
What is the expected one-year interest rate on a 1-year 1-Bill in four years? 12. YOP, Inc has a 3-year outstanding bond with 13% yield. Investors expect to earn an average of 3% in real rate of return. Inflation is expected to be 1.5%, 2.0% and 4% for the next 3 years. Its lack of popularity in the financial market requires it to pay 2.5% for its lack of liquidity, and its relatively short amount of time before maturity...
Most questions answered within 3 hours.
-
A barium hydroxide solution is prepared by dissolving 1.91 g1.91
g of Ba(OH)2Ba(OH)2 in water to...
asked 10 minutes ago -
barium oxide with water Express your answer as a chemical
equation. Identify all of the phases...
asked 14 minutes ago -
In the laboratory a "coffee cup"
calorimeter, or constant pressure calorimeter, is
frequently used to determine...
asked 12 minutes ago -
Refer to the following table to answer the next five questions:
Number of Workers Output 1...
asked 16 minutes ago -
As part of Canadian government efforts to boost up economic
trade with international community, on February...
asked 13 minutes ago -
Deinococcus radiodurans is probably the world’s toughest
bacterium (first discovered growing in ground meat that had...
asked 10 minutes ago -
Which Model can be selected if user is involved in all phases of
sdlc.
select one...
asked 17 minutes ago -
An initial solution is made by combing 13 mL of 0.8 M
chloroacetic acid with 20...
asked 22 minutes ago -
Pellets of mass 2.0 g are fired in parallel paths with speeds of
120 m/s through...
asked 27 minutes ago -
You perform a study to investigate whether exercise influences
sleep duration. Participants record their total sleep...
asked 30 minutes ago -
The cell Cu(s)(1M) | Cu2+ || (1M) |
Cu(s) has E = 0.182 V
The cell...
asked 42 minutes ago -
i. y[n + 1] + 1.5y[n] = x[n]
ii. y[n + 1] + 0.8y[n] = x[n]...
asked 45 minutes ago