
Homework Answers
Answer:
MINITAB used
a).

Lavene's test , P=0.872 which is > 0.05 level shows that the normality assumption is not violated.
One-way ANOVA: Insecticide 1, Insecticide 2, Insecticide ... secticide 4
Method
|
Null hypothesis |
All means are equal |
|
Alternative hypothesis |
Not all means are equal |
|
Significance level |
α = 0.05 |
Equal variances were assumed for the analysis.
Factor Information
|
Factor |
Levels |
Values |
|
Factor |
4 |
Insecticide 1, Insecticide 2, Insecticide 3, Insecticide 4 |
Analysis of Variance
|
Source |
DF |
Adj SS |
Adj MS |
F-Value |
P-Value |
|
Factor |
3 |
12.83 |
4.2778 |
4.50 |
0.014 |
|
Error |
20 |
19.00 |
0.9500 |
||
|
Total |
23 |
31.83 |
Model Summary
|
S |
R-sq |
R-sq(adj) |
R-sq(pred) |
|
0.974679 |
40.31% |
31.36% |
14.05% |
Means
|
Factor |
N |
Mean |
StDev |
95% CI |
|
Insecticide 1 |
6 |
6.167 |
0.753 |
(5.337, 6.997) |
|
Insecticide 2 |
6 |
5.333 |
1.033 |
(4.503, 6.163) |
|
Insecticide 3 |
6 |
4.333 |
1.033 |
(3.503, 5.163) |
|
Insecticide 4 |
6 |
4.500 |
1.049 |
(3.670, 5.330) |
Pooled StDev = 0.974679
Calculated F= 4.50, P=0.014 which is < 0.05 level of significance. Ho is rejected. We conclude that mean number of strawberries per plant that is different for the 4 insecticides.
b).
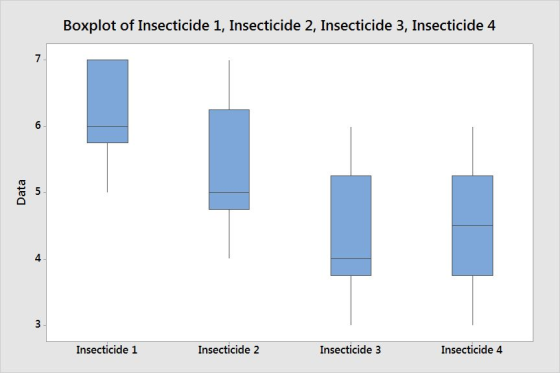
The box plot support the decision of part a.
Add Answer to:
Directions: Use the P-value Approach for all hypothesis tests. Follow all the steps used in hypothesis...
Directions: Use the P-value Approach for all hypothesis tests. Follow all the steps used in hypothesis...
 Directions: Use the P-value Approach for all hypothesis tests. Follow all the steps used in hypothesis testing as delineated in the Guided Notes or the textbook and be sure to verify the conditions for each test. Include any StatCrunch, SurfStat, graphing calculator, etc.. output used in the process. I am assuming that all questions will be answered using technology-it is no necessary to include by-hand construction of the test statistics. Submitting test statistics only will not earn you full credit...
Directions: Use the P-value Approach for all hypothesis tests. Follow all the steps used in hypothesis...
 Directions: Use the P-value Approach for all hypothesis tests. Follow all the steps used in hypothesis testing as delineated in the Guided Notes or the textbook and be sure to verify the conditions for each test. Include any StatCrunch, Surfstat, graphing calculator, etc... output used in the process. I am assuming that all questions will be answered using technology-it is not necessary to include by-hand construction of the test statistics. Submitting test statistics only will not earn you full credit...
Four different types of insecticides are used on strawberry plants. The number of strawberries on each randomly selected plant is given below. Insecticide 1 Insecticide 2 Insecticide 3 Insec...
Four different types of insecticides are used on strawberry plants. The number of strawberries on each randomly selected plant is given below. Insecticide 1 Insecticide 2 Insecticide 3 Insecticide 4 6 5 6 6 7 7 5 5 6 5 4 4 5 4 3 4 7 5 4 5 6 6 4 3 Does the data suggest that any of these insecticides yield a mean number of strawberries per plant that is different from the others? Use a 5%...
Four different types of insecticides are used on strawberry plants. The number of strawberries on each...
Four different types of insecticides are used on strawberry plants. The number of strawberries on each randomly selected plant is given below. Insecticide 1 Insecticide 2 Insecticide 3 Insecticide 4 6 5 6 6 7 7 5 5 6 5 4 4 5 4 3 4 7 5 4 5 6 6 4 3 Does the data suggest that any of these insecticides yield a mean number of strawberries per plant that is different from the others? Use a 5%...
Directions: Please show your work. Submitting answers only will not earn you full credit for a...
Directions: Please show your work. Submitting answers only will not earn you full credit for a given problem. Showing work includes, but is not limited to: formulas, graphs, and calculations. If you use the web calculator, StatCrunch, Minitab, Excel, Table V, Graphing Calculator, etc…, you must include your output with your answer (I suggest using the Snipping Tool in Windows). Use the prescribed method of test (Classical or P-value) for each question. Follow all the steps used in hypothesis testing...
20) Find the critical value from the Studentized range distribution for a = 0.01, v =...
 20) Find the critical value from the Studentized range distribution for a = 0.01, v = 10, k = 4. (2 pts) 21) Find the critical value from the Studentized range distribution for Ho: 1 = 42 = 13 = = 45, with n=18 at a =0.01.(2 pts) MULTIPLE CHOICE. 22) Four different types of insecticides are used on strawberry plants. The number of strawberries on each randomly selected plant is given below. Use a -0.01. Which of the following...
Directions: Please show your work. Submitting answers only will not earn you full credit for a...
Directions: Please show your work. Submitting answers only will not earn you full credit for a given problem. Showing work includes, but is not limited to: formulas, graphs, and calculations. If you use the web calculator, StatCrunch, Minitab, Excel, Table V, Graphing Calculator, etc…, you must include your output with your answer (I suggest using the Snipping Tool in Windows). Use the prescribed method of test (Classical or P-value) for each question. Follow all the steps used in hypothesis testing...
Directions: Please show your work. Submitting answers only will not earn you full credit for a...
 Directions: Please show your work. Submitting answers only will
not earn you full credit for a given problem. Showing work
includes, but is not limited to: formulas, graphs, and
calculations. If you use the web calculator, StatCrunch, Minitab,
Excel, Table V, Graphing Calculator, etc…, you must include your
output with your answer (I suggest using the Snipping Tool in
Windows). Use the prescribed method of test (Classical or P-value)
for each question. Follow all the steps used in hypothesis testing...
Directions: Please show your work. Submitting answers only will
not earn you full credit for a given problem. Showing work
includes, but is not limited to: formulas, graphs, and
calculations. If you use the web calculator, StatCrunch, Minitab,
Excel, Table V, Graphing Calculator, etc…, you must include your
output with your answer (I suggest using the Snipping Tool in
Windows). Use the prescribed method of test (Classical or P-value)
for each question. Follow all the steps used in hypothesis testing...
Question: For all hypothesis tests, be sure to include information for all 7 steps. For any...
Question: For all hypothesis tests, be sure to include information for all 7 steps. For any two-sample or p... For all hypothesis tests, be sure to include information for all 7 steps. For any two-sample or paired t-tests that you perform, in Step 6, show the decision rule based on BOTH the critical value and the p-value. Use the online app for the t-distribution to compute your p-values. 1. Cortisol level determinations were made on two samples of women at...
Problem 4: One Sample T-Tests. For the following investigations, include all Steps of Hypothesis Testing Investigation...
 Problem 4: One Sample T-Tests. For the following investigations, include all Steps of Hypothesis Testing Investigation A: A university wants to see if their statistics lab instructors receive student ratings that are higher than the population mean of 5.0. For a sample of 30 statistics lab instructors from that university. M= 5.3 and S- i. Conduct the appropriate statistical test using α-05 Investigation B. A researcher wants to see if children with autism are different than the population mean of...
 Directions: Use the P-value Approach for all hypothesis tests. Follow all the steps used in hypothesis testing as delineated in the Guided Notes or the textbook and be sure to verify the conditions for each test. Include any StatCrunch, SurfStat, graphing calculator, etc.. output used in the process. I am assuming that all questions will be answered using technology-it is no necessary to include by-hand construction of the test statistics. Submitting test statistics only will not earn you full credit...
 Directions: Use the P-value Approach for all hypothesis tests. Follow all the steps used in hypothesis testing as delineated in the Guided Notes or the textbook and be sure to verify the conditions for each test. Include any StatCrunch, Surfstat, graphing calculator, etc... output used in the process. I am assuming that all questions will be answered using technology-it is not necessary to include by-hand construction of the test statistics. Submitting test statistics only will not earn you full credit...
 20) Find the critical value from the Studentized range distribution for a = 0.01, v = 10, k = 4. (2 pts) 21) Find the critical value from the Studentized range distribution for Ho: 1 = 42 = 13 = = 45, with n=18 at a =0.01.(2 pts) MULTIPLE CHOICE. 22) Four different types of insecticides are used on strawberry plants. The number of strawberries on each randomly selected plant is given below. Use a -0.01. Which of the following...
 Directions: Please show your work. Submitting answers only will
not earn you full credit for a given problem. Showing work
includes, but is not limited to: formulas, graphs, and
calculations. If you use the web calculator, StatCrunch, Minitab,
Excel, Table V, Graphing Calculator, etc…, you must include your
output with your answer (I suggest using the Snipping Tool in
Windows). Use the prescribed method of test (Classical or P-value)
for each question. Follow all the steps used in hypothesis testing...
Directions: Please show your work. Submitting answers only will
not earn you full credit for a given problem. Showing work
includes, but is not limited to: formulas, graphs, and
calculations. If you use the web calculator, StatCrunch, Minitab,
Excel, Table V, Graphing Calculator, etc…, you must include your
output with your answer (I suggest using the Snipping Tool in
Windows). Use the prescribed method of test (Classical or P-value)
for each question. Follow all the steps used in hypothesis testing...
 Problem 4: One Sample T-Tests. For the following investigations, include all Steps of Hypothesis Testing Investigation A: A university wants to see if their statistics lab instructors receive student ratings that are higher than the population mean of 5.0. For a sample of 30 statistics lab instructors from that university. M= 5.3 and S- i. Conduct the appropriate statistical test using α-05 Investigation B. A researcher wants to see if children with autism are different than the population mean of...
Most questions answered within 3 hours.
-
Walgreen Company (NYSE: WAG) is currently trading at $48.50 on
the NYSE. Walgreen Company is also...
asked 54 seconds ago -
Based on historical data, your team knows what proportion of the
company's orders come from Males...
asked 18 minutes ago -
8. Which of the following atoms has the largest magnitude
electron affinity?
(a) Sodium (Na)
(b)...
asked 21 minutes ago -
Assess the two types of tests of cognitive abilities. (
regarding HR course)
asked 26 minutes ago -
1.Write an inspiring vision statement for an organization where
you work or have worked. If the...
asked 27 minutes ago -
2. Is fair trade coffee sustainable for the mass market,
or is it a niche product...
asked 28 minutes ago -
Please answer this asap in MATLAB.
In the following for loop, the the loop is executed...
asked 40 minutes ago -
A 50.0-g golf ball is driven from the tee with an initial speed
of 44.6 m/s...
asked 35 minutes ago -
Use the molar concentration of the 50 mL solution to calculate
the moles of Cr(III) in...
asked 37 minutes ago -
Calculate the molarity of Fe3+ in solution A.
Solution A: 10 mL of 0.0600 M Fe(No3)3 ...
asked 46 minutes ago -
two dogs pull 2 strings horizontally which are tied to a sleigh.
the angle between the...
asked 47 minutes ago -
please write a paper about any ethical violation based on the
case study Stanford's Prison Experiment....
asked 1 hour ago