Project question 1 Using the data in the file named Chapter 11 Data Set 2, test...
Project question 1
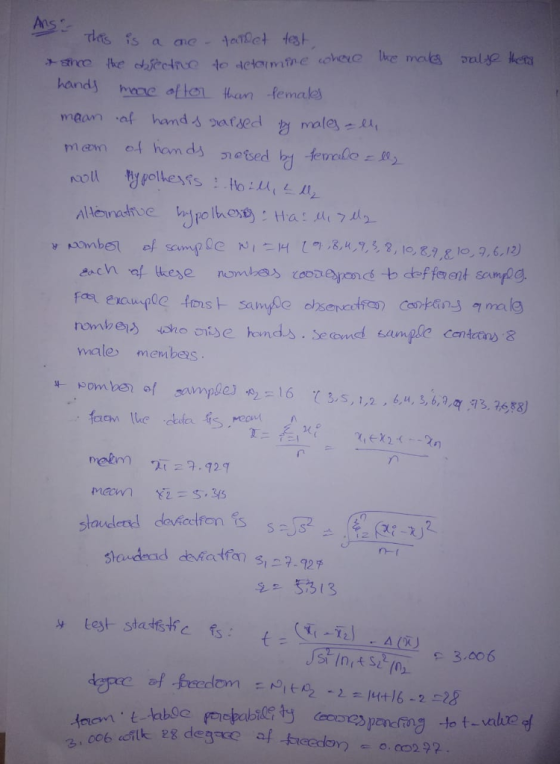
Using the data in the file named Chapter 11 Data Set 2, test the research hypothesis at the .05 level of significance that males raise their hands in class more often than females. Do this practice problem by hand using a calculator. What is your conclusion regarding the research hypothesis? Remember to first decide whether this is a one- or two tailed test.
|
Males |
Females |
|
9 |
3 |
|
8 |
5 |
|
4 |
1 |
|
9 |
2 |
|
3 |
6 |
|
8 |
4 |
|
10 |
3 |
|
8 |
6 |
|
9 |
7 |
|
8 |
9 |
|
10 |
7 |
|
7 |
3 |
|
6 |
7 |
|
12 |
6 |
|
8 |
|
|
8 |
Homework Answers

Add Answer to:
Project question 1
Using the data in the file named Chapter 11 Data Set 2, test...
Question A. The below data correspond to an independent-measures t test. 1. Provide a hypothetical research...
 Question A. The below data correspond to an independent-measures t test. 1. Provide a hypothetical research question that is appropriate for an independent- measures t test. 2. Identify the independent and dependent variables of your research design, including the levels of the independent variable. 3. Describe what an alpha level is, and what the alpha level's relationship is to the null hypothesis in the specific context of your research study. 4. Using the following data below, determine whether the data...
ANOVA Homework 1. How is an ANOVA different from a t-test? 2. When and why do...
 ANOVA Homework 1. How is an ANOVA different from a t-test? 2. When and why do you use a post-hoc test? Indicate when you use a Fisher's test vs. a Tukey's HSD. 3. A researcher was interested in examining the decision making processes of people who work different shifts in a factory. They ask the participants from each shift to answer a set of questions regarding how they would deal with potential issues in the factory. Below are the scores...
Statistics for people who (think they) hate statistics 4th Edition Using the data in Chapter 15...
Statistics for people who (think they) hate statistics 4th Edition Using the data in Chapter 15 Data Set 1 to answer the questions below. Do the analysis manually or using the Data Analysis tools in excel. a. Compute the correlation between motivation and GPA. b. Test for the significance of the correlation coefficient at the .05 level using a two-tailed test. c. The more highly you are motivated, the more you will study- true or false? which did you select...
Using the data in the file named “Dataset 1,” to determine is there was a change...
Using the data in the file named “Dataset 1,” to determine is there was a change in the number of tons of paper used after the implementation of a recycling program in 25 different districts. a. Is this study using dependent or independent samples? b. What is your research hypothesis? c. Using Excel, calculate your test statistic and p-value. Paste the output here. d. What do you conclude? Below is the data set that is mentioned above Before Recycling 20...
1. What are null hypothesis and alternative hypothesis? 2. Inastatisticaltest,wehavethechoiceofatwo-tailedtest,aleft- tailed test, or a right-tailed test. Which hypothesis is the determining factor fo...
1. What are null hypothesis and alternative hypothesis? 2. Inastatisticaltest,wehavethechoiceofatwo-tailedtest,aleft- tailed test, or a right-tailed test. Which hypothesis is the determining factor for choosing the direction of the test? (In other words, how would you decide it) 3. Forthesamesampledataandnullhypothesis,howdoesthe P-value for a two-tailed test compare to that for a one-tailed test? 4. Using P-value method, how would you reject or fail to reject the null hypothesis? (what is the decision criteria?) How does level of significance matter to the hypothesis...
Scenario Three: A group of parents believes that the proportion of students who find their college...
Scenario Three: A group of parents believes that the proportion of students who find their college experience extremely rewarding does not equal 50%. They decide to test this hypothesis using a significance level of .05. They conduct a random sample of 100 students and 34 say they find their college experience extremely rewarding. You only need to redo the steps below to receive full credit for scenario three. Based on the type of test this is (right, left, or two-tailed);...
please explain throughly It doesn’t need sample data. That’s how the question was intended to be. Il. A friends someone has. A tailed test friends so was done to test whether the amount of narcis...
 please explain throughly
It
doesn’t need sample data. That’s how the question was intended to
be.
Il. A friends someone has. A tailed test friends so was done to test whether the amount of narcissism is a good predictor of number of sample of 10 participants was used. Assume an alpha level of.05 and a two- of 9. What statistical test should you use to evaluate the hypothesis above? 10. What are the null and alternative hypotheses in words? Null...
please explain throughly
It
doesn’t need sample data. That’s how the question was intended to
be.
Il. A friends someone has. A tailed test friends so was done to test whether the amount of narcissism is a good predictor of number of sample of 10 participants was used. Assume an alpha level of.05 and a two- of 9. What statistical test should you use to evaluate the hypothesis above? 10. What are the null and alternative hypotheses in words? Null...
(All one question) that is the full question 1. Suppose we want to test the claim...
 (All one question)
that is the full question
1. Suppose we want to test the claim that Connecticut and New York have the same proportion of cars with rear license plates only. Below is data from randomly selected cars in Connecticut and New York. Use a .05 significance level to test this claim. Cars with rear license plates only Cars with front and rear license plates 1810 Connecticut New York 239 9 541 2049 550 Total a. Check that requirements...
(All one question)
that is the full question
1. Suppose we want to test the claim that Connecticut and New York have the same proportion of cars with rear license plates only. Below is data from randomly selected cars in Connecticut and New York. Use a .05 significance level to test this claim. Cars with rear license plates only Cars with front and rear license plates 1810 Connecticut New York 239 9 541 2049 550 Total a. Check that requirements...
this is a single sample t test problem this is math Assignment #11 Single Sample t-Test...
 this is a single sample t test problem
this is math
Assignment #11 Single Sample t-Test What factor determines whether you should use a z-test or a t-test statistic for a hypothesis test? 11.1 A sample is selected from a population mean of u 30. A treatment is administered to the individuals in the sample and, after treatment, the sample mean found to be M 11.2 = 31.3 with a sample variance of s2 9 If the sample consists of...
this is a single sample t test problem
this is math
Assignment #11 Single Sample t-Test What factor determines whether you should use a z-test or a t-test statistic for a hypothesis test? 11.1 A sample is selected from a population mean of u 30. A treatment is administered to the individuals in the sample and, after treatment, the sample mean found to be M 11.2 = 31.3 with a sample variance of s2 9 If the sample consists of...
Data Conduct an independent samples t-test (a.k.a., between-subjects design). Each sample should have at least n...
 Data
Conduct an independent samples t-test (a.k.a., between-subjects design). Each sample should have at least n=8 individuals. What to turn in: 1. What is your research question? 2. State the null (Ho) and alternative (H1) hypotheses. 3. Conduct the hypothesis test using an alpha level of .05, and state your conclusion (Reject Ho/Fail to Reject Ho) regarding the original hypotheses. 4. Calculate and interpret a measure of effect size (est. Cohen's d or r2) and a 95% confidence interval. Subject...
Data
Conduct an independent samples t-test (a.k.a., between-subjects design). Each sample should have at least n=8 individuals. What to turn in: 1. What is your research question? 2. State the null (Ho) and alternative (H1) hypotheses. 3. Conduct the hypothesis test using an alpha level of .05, and state your conclusion (Reject Ho/Fail to Reject Ho) regarding the original hypotheses. 4. Calculate and interpret a measure of effect size (est. Cohen's d or r2) and a 95% confidence interval. Subject...
 Question A. The below data correspond to an independent-measures t test. 1. Provide a hypothetical research question that is appropriate for an independent- measures t test. 2. Identify the independent and dependent variables of your research design, including the levels of the independent variable. 3. Describe what an alpha level is, and what the alpha level's relationship is to the null hypothesis in the specific context of your research study. 4. Using the following data below, determine whether the data...
 ANOVA Homework 1. How is an ANOVA different from a t-test? 2. When and why do you use a post-hoc test? Indicate when you use a Fisher's test vs. a Tukey's HSD. 3. A researcher was interested in examining the decision making processes of people who work different shifts in a factory. They ask the participants from each shift to answer a set of questions regarding how they would deal with potential issues in the factory. Below are the scores...
 please explain throughly
It
doesn’t need sample data. That’s how the question was intended to
be.
Il. A friends someone has. A tailed test friends so was done to test whether the amount of narcissism is a good predictor of number of sample of 10 participants was used. Assume an alpha level of.05 and a two- of 9. What statistical test should you use to evaluate the hypothesis above? 10. What are the null and alternative hypotheses in words? Null...
please explain throughly
It
doesn’t need sample data. That’s how the question was intended to
be.
Il. A friends someone has. A tailed test friends so was done to test whether the amount of narcissism is a good predictor of number of sample of 10 participants was used. Assume an alpha level of.05 and a two- of 9. What statistical test should you use to evaluate the hypothesis above? 10. What are the null and alternative hypotheses in words? Null...
 (All one question)
that is the full question
1. Suppose we want to test the claim that Connecticut and New York have the same proportion of cars with rear license plates only. Below is data from randomly selected cars in Connecticut and New York. Use a .05 significance level to test this claim. Cars with rear license plates only Cars with front and rear license plates 1810 Connecticut New York 239 9 541 2049 550 Total a. Check that requirements...
(All one question)
that is the full question
1. Suppose we want to test the claim that Connecticut and New York have the same proportion of cars with rear license plates only. Below is data from randomly selected cars in Connecticut and New York. Use a .05 significance level to test this claim. Cars with rear license plates only Cars with front and rear license plates 1810 Connecticut New York 239 9 541 2049 550 Total a. Check that requirements...
 this is a single sample t test problem
this is math
Assignment #11 Single Sample t-Test What factor determines whether you should use a z-test or a t-test statistic for a hypothesis test? 11.1 A sample is selected from a population mean of u 30. A treatment is administered to the individuals in the sample and, after treatment, the sample mean found to be M 11.2 = 31.3 with a sample variance of s2 9 If the sample consists of...
this is a single sample t test problem
this is math
Assignment #11 Single Sample t-Test What factor determines whether you should use a z-test or a t-test statistic for a hypothesis test? 11.1 A sample is selected from a population mean of u 30. A treatment is administered to the individuals in the sample and, after treatment, the sample mean found to be M 11.2 = 31.3 with a sample variance of s2 9 If the sample consists of...
 Data
Conduct an independent samples t-test (a.k.a., between-subjects design). Each sample should have at least n=8 individuals. What to turn in: 1. What is your research question? 2. State the null (Ho) and alternative (H1) hypotheses. 3. Conduct the hypothesis test using an alpha level of .05, and state your conclusion (Reject Ho/Fail to Reject Ho) regarding the original hypotheses. 4. Calculate and interpret a measure of effect size (est. Cohen's d or r2) and a 95% confidence interval. Subject...
Data
Conduct an independent samples t-test (a.k.a., between-subjects design). Each sample should have at least n=8 individuals. What to turn in: 1. What is your research question? 2. State the null (Ho) and alternative (H1) hypotheses. 3. Conduct the hypothesis test using an alpha level of .05, and state your conclusion (Reject Ho/Fail to Reject Ho) regarding the original hypotheses. 4. Calculate and interpret a measure of effect size (est. Cohen's d or r2) and a 95% confidence interval. Subject...
Most questions answered within 3 hours.
-
6. Suppose that the Bank of Canada conducts an open market
purchase of $2000 from a...
asked 9 seconds ago -
Try to get the code down to less than 40 lines. (PYTHON)
import random
fave_number =...
asked 6 minutes ago -
A Chi-square distribution with 14 degrees of freedom is a
correct model for
Question 8 options:...
asked 3 minutes ago -
c. Node Admittance matrix and its use in different calculations
of power transmission system. Display the...
asked 6 minutes ago -
A) Suppose U=X∙Y3. Find X* and Y*.
B) Suppose U=X3∙Y. Find X* and Y*.
C) Suppose...
asked 8 minutes ago -
2.
Regression analysis was applied between sales (in $1,000) and
advertising (in $100), and the following...
asked 14 minutes ago -
I just took a final for chemistry 2. There were alot of
questions on cell potential....
asked 46 minutes ago -
A spherical weather balloon is filled with hydrogen until its
radius is 2.30 m. Its total...
asked 11 minutes ago -
Calculate the entropy change for the hypothetical process in
which 0.5 g of ice at 0°C...
asked 33 minutes ago -
When an airplane is flying 200 mph at 5000-ft altitude in a
standard atmosphere, the air...
asked 21 minutes ago -
Consider the economy of Freeland, whose overall actual price
index and actual output are P and...
asked 34 minutes ago -
Your car is worth considerably less money than you owe.
This is an example of the...
asked 33 minutes ago