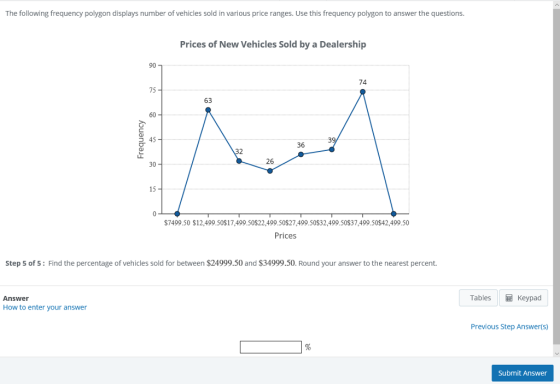
The following frequency polygon displays number of vehicles sold in various price ranges. Use this frequency polygon to answer the questions.
Find the percentage of vehicles sold for between $24999.50$24999.50 and $34999.50$34999.50. Round your answer to the nearest percent.
Homework Answers
total frequency =63+32+26+36+39+74=270
number of vehicles between 24999.5 and 34999.50 =36+39=75
hence % of vehicles between 24999.5 and 34999.50 =(75/270)*100 =27.78% =28%
Add Answer to:
The following frequency polygon displays number of vehicles sold
in various price ranges. Use this frequency...
BUSINESS DECISION: THE ULTIMATE TRADE DISCOUNT A General Motors incentive program designed to reduce inventory of...
BUSINESS DECISION: THE ULTIMATE TRADE DISCOUNT A General Motors incentive program designed to reduce inventory of certain low-selling models offers a $6,600 extra dealer incentive for each of these vehicles that the dealer moved into its rental or service fleets. As the accountant for a dealership with a number of these vehicles left in stock, your manager has asked you to calculate certain invoice figures. The normal trade discount from GM is 13%. If the average sticker price (list price)...
The following data represent the number of oranges, in hundreds, which were sold by various grocery...
 The following data represent the number of oranges, in hundreds, which were sold by various grocery stores in the month of May. Construct a dot plot for the given data. 10 13 2 13 81 5 6 7 5 11 13 5 3 11 16 Copy Data Answer Tables Keypad Select any value to see the controls for increasing or decreasing the frequency. Use the up and down arrows or drag the slider to change the number of dots. 02...
Consider the relationship between the number of bids an item on eBay received and the item's...
 Consider the relationship between the number of bids an item on eBay received and the item's selling price. The following is a sample of 5 items sold through an auction. Price in Dollars 29 32 40 45 49 Number of Bids 7 89 Table Copy Data Step 3 of 5: Calculate the estimated variance of slope, s. Round your answer to three decimal places. Answer(How to Enter) 2 Points Keypad BTables Next Step 4 of 5: Construct the 95 %...
Question Number of Laptops Frequency The frequency distribution to the right shows the various levels of...
 Question Number of Laptops Frequency The frequency distribution to the right shows the various levels of demand for a particular laptop computer sold by a store during the last 50 business days. Determine the average number of laptops sold per day د N بيا د ن The average number of laptops sold per day is (Do not round.) Enter your answer in the answer box ation is often called the standard error of the mean, or stan
Please rate I’ll give a thumbs up! Consider the relationship between the number of bids an...
 Please rate I’ll give a thumbs up!
Consider the relationship between the number of bids an item on eBay received and the item's selling price. The following is a sample of 5 items sold through an auction. Price in Dollars 29 32 40 45 49 Number of Bids 23 7 89 Table Copy Data Step 1 of S: Calculate the sum of squared errors (SSE). Use the values bo-8.3804 and b10.3636 for the calculations. Round your answer to three decimal...
Please rate I’ll give a thumbs up!
Consider the relationship between the number of bids an item on eBay received and the item's selling price. The following is a sample of 5 items sold through an auction. Price in Dollars 29 32 40 45 49 Number of Bids 23 7 89 Table Copy Data Step 1 of S: Calculate the sum of squared errors (SSE). Use the values bo-8.3804 and b10.3636 for the calculations. Round your answer to three decimal...
According to sales information in the first quarter of 2015, 3.4% of the new vehicles sold...
According to sales information in the first quarter of 2015, 3.4% of the new vehicles sold in the United States were hybrids. This is down from 3.8% for the same period a year earlier. An analyst's review of the data indicates that the reasons for the sales decline include the low price of gasoline and the higher price of a hybrid compared to similar vehicles. Let’s assume these statistics remain the same for 2016. That is, 3.4 percent of the...
The table below gives the list price and the number of bids received for five randomly...
 The table below gives the list price and the number of bids received for five randomly selected items sold through online auctions. Using this data, consider the equation of the regression line, ý = bo + b1x, for predicting the number of bids an item will receive based on the list price. Keep in mind, the correlation coefficient may or may not be statistically significant for the data given. Remember, in practice, it would not be appropriate to use the...
The following histogram shows the exam scores for a Prealgebra class. Use this histogram to answer...
 The following histogram shows the exam scores for a Prealgebra
class. Use this histogram to answer the questions. Prealgebra Exam
Scores
Scores 70.5, 75.5, 80.5, 85.5, 90.5, 95.5, 100.5
Frequency 0, 4, 8, 12, 16, 20, 24
Step 1 of 5: Find the number of the class containing the largest
number of exam scores (1, 2, 3, 4, 5, or 6).
Step 2 of 5: Find the upper class limit of the third class. Step
3 of 5: Find the...
The following histogram shows the exam scores for a Prealgebra
class. Use this histogram to answer the questions. Prealgebra Exam
Scores
Scores 70.5, 75.5, 80.5, 85.5, 90.5, 95.5, 100.5
Frequency 0, 4, 8, 12, 16, 20, 24
Step 1 of 5: Find the number of the class containing the largest
number of exam scores (1, 2, 3, 4, 5, or 6).
Step 2 of 5: Find the upper class limit of the third class. Step
3 of 5: Find the...
The following histogram shows the exam scores for a Prealgebra class. Use this histogram to answer...
The following histogram shows the exam scores for a Prealgebra class. Use this histogram to answer the questions. Prealgebra Exam Scores Scores 70.5, 75.5, 80.5, 85.5, 90.5, 95.5, 100.5 Frequency 0, 4, 8, 12, 16, 20, 24 Step 1 of 5: Find the number of the class containing the largest number of exam scores (1, 2, 3, 4, 5, or 6). Step 2 of 5: Find the upper class limit of the third class. Step 3 of 5: Find the...
Please help with this problem! It has five parts uestion 5 of 11 Step 1 of...
 Please help with this problem! It has five parts
uestion 5 of 11 Step 1 of 5 01:20:14 Consider the relationship between the number of bids an item on eBay received and the item's selling price. The following is a sample of 5 items sold through an auction. Price in Dollars 29 32 40 45 49 Number of Bids 2 3 7 89 Table Copy Data Step 1 of S: Calculate the sum of squared errors (SSE), Use the values...
Please help with this problem! It has five parts
uestion 5 of 11 Step 1 of 5 01:20:14 Consider the relationship between the number of bids an item on eBay received and the item's selling price. The following is a sample of 5 items sold through an auction. Price in Dollars 29 32 40 45 49 Number of Bids 2 3 7 89 Table Copy Data Step 1 of S: Calculate the sum of squared errors (SSE), Use the values...
 The following data represent the number of oranges, in hundreds, which were sold by various grocery stores in the month of May. Construct a dot plot for the given data. 10 13 2 13 81 5 6 7 5 11 13 5 3 11 16 Copy Data Answer Tables Keypad Select any value to see the controls for increasing or decreasing the frequency. Use the up and down arrows or drag the slider to change the number of dots. 02...
 Consider the relationship between the number of bids an item on eBay received and the item's selling price. The following is a sample of 5 items sold through an auction. Price in Dollars 29 32 40 45 49 Number of Bids 7 89 Table Copy Data Step 3 of 5: Calculate the estimated variance of slope, s. Round your answer to three decimal places. Answer(How to Enter) 2 Points Keypad BTables Next Step 4 of 5: Construct the 95 %...
 Question Number of Laptops Frequency The frequency distribution to the right shows the various levels of demand for a particular laptop computer sold by a store during the last 50 business days. Determine the average number of laptops sold per day د N بيا د ن The average number of laptops sold per day is (Do not round.) Enter your answer in the answer box ation is often called the standard error of the mean, or stan
 Please rate I’ll give a thumbs up!
Consider the relationship between the number of bids an item on eBay received and the item's selling price. The following is a sample of 5 items sold through an auction. Price in Dollars 29 32 40 45 49 Number of Bids 23 7 89 Table Copy Data Step 1 of S: Calculate the sum of squared errors (SSE). Use the values bo-8.3804 and b10.3636 for the calculations. Round your answer to three decimal...
Please rate I’ll give a thumbs up!
Consider the relationship between the number of bids an item on eBay received and the item's selling price. The following is a sample of 5 items sold through an auction. Price in Dollars 29 32 40 45 49 Number of Bids 23 7 89 Table Copy Data Step 1 of S: Calculate the sum of squared errors (SSE). Use the values bo-8.3804 and b10.3636 for the calculations. Round your answer to three decimal...
 The table below gives the list price and the number of bids received for five randomly selected items sold through online auctions. Using this data, consider the equation of the regression line, ý = bo + b1x, for predicting the number of bids an item will receive based on the list price. Keep in mind, the correlation coefficient may or may not be statistically significant for the data given. Remember, in practice, it would not be appropriate to use the...
 The following histogram shows the exam scores for a Prealgebra
class. Use this histogram to answer the questions. Prealgebra Exam
Scores
Scores 70.5, 75.5, 80.5, 85.5, 90.5, 95.5, 100.5
Frequency 0, 4, 8, 12, 16, 20, 24
Step 1 of 5: Find the number of the class containing the largest
number of exam scores (1, 2, 3, 4, 5, or 6).
Step 2 of 5: Find the upper class limit of the third class. Step
3 of 5: Find the...
The following histogram shows the exam scores for a Prealgebra
class. Use this histogram to answer the questions. Prealgebra Exam
Scores
Scores 70.5, 75.5, 80.5, 85.5, 90.5, 95.5, 100.5
Frequency 0, 4, 8, 12, 16, 20, 24
Step 1 of 5: Find the number of the class containing the largest
number of exam scores (1, 2, 3, 4, 5, or 6).
Step 2 of 5: Find the upper class limit of the third class. Step
3 of 5: Find the...
 Please help with this problem! It has five parts
uestion 5 of 11 Step 1 of 5 01:20:14 Consider the relationship between the number of bids an item on eBay received and the item's selling price. The following is a sample of 5 items sold through an auction. Price in Dollars 29 32 40 45 49 Number of Bids 2 3 7 89 Table Copy Data Step 1 of S: Calculate the sum of squared errors (SSE), Use the values...
Please help with this problem! It has five parts
uestion 5 of 11 Step 1 of 5 01:20:14 Consider the relationship between the number of bids an item on eBay received and the item's selling price. The following is a sample of 5 items sold through an auction. Price in Dollars 29 32 40 45 49 Number of Bids 2 3 7 89 Table Copy Data Step 1 of S: Calculate the sum of squared errors (SSE), Use the values...
Most questions answered within 3 hours.
-
Using MARS simulator, write MIPS programs according to
the following scenarios: Receive a positive integer number...
asked 44 minutes ago -
An object in front of a concave mirror has a real image that is
11.5 cm...
asked 58 minutes ago -
Consider the reaction, C3 H8 + O2 --> CO2 + H2O. How many
moles of O2...
asked 2 hours ago -
You and your opponent both roll a fair die. If you both roll the
same number,...
asked 2 hours ago -
In a study of the accuracy of fast food drive-through orders,
Restaurant A had 257 accurate...
asked 2 hours ago -
Identify and describe in detail the four categories of
institutions that could be included in a...
asked 3 hours ago -
In python
class Customer:
def __init__(self, customer_id, last_name, first_name, phone_number, address):
self._customer_id = int(customer_id)
self._last_name =...
asked 3 hours ago -
What is an example of a limitation in implementing a new
ERP system and how it...
asked 3 hours ago -
In a section of 9.7cm of an artery with a radius of 2.6mm there
is a...
asked 3 hours ago -
the two carboxylic acid groups of aspartic acid have different
acidities with pKa values of 2.1...
asked 3 hours ago -
Would CuCO3 aqueous salt combined with calcium chloride
form a solid precipitate? If so, what would...
asked 3 hours ago -
How do ECM Solutions assist in embedding a culture of continuous
improvement in an organization? (Project...
asked 3 hours ago