
Already uploaded this question and the answer was wrong. Please only answer if you know you are correct. Thank you!
Homework Answers
a) The formula for minimum risk weights in a two stock portfolio is
![Ws = [06-09 *OB* PBS]/[0+os – 2* 09*0B * PBS](http://img.homeworklib.com/questions/340d27d0-75cd-11ea-8bfa-b9b358b056e9.png?x-oss-process=image/resize,w_560)
So, WS = (0.232 -0.23*0.32 *0.15) / ( 0.322+0.232 -2*0.23*0.32 *0.15)
= 0.3142 = 31.42%
and WB = 1- WS = 1-0.3142 =0.6858=68.58%
So, portfolio weight for stock fund is 0.31
b) The standard deviation of a portfolio is given by
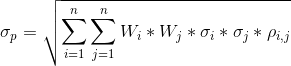
=sqrt (0.3142^2*0.32^2+0.6858^2*0.23^2+2 *0.23*0.32*0.3142*0.6858*0.14)
= sqrt (0.03943)
=0.198569
=19.86%
Add Answer to:
Already uploaded this question and the answer was wrong. Please
only answer if you know you...
The following questions are in order: Question 1 1 pts The following data applies to Questions...
 The following questions are in order:
Question 1 1 pts The following data applies to Questions 1 to 3 Consider two risky assets: a stock fund and a bond fund with the following probability distributions. Scenario Severe recession Mild recession Normal growth Boom What is the expected return for the bond fund? Your answer should be in percentage points and accurate to the hundredth. For example, if your answer is 10.2511%, then type in 10.25 Probability 0.05 0.25 0.40 0.30...
The following questions are in order:
Question 1 1 pts The following data applies to Questions 1 to 3 Consider two risky assets: a stock fund and a bond fund with the following probability distributions. Scenario Severe recession Mild recession Normal growth Boom What is the expected return for the bond fund? Your answer should be in percentage points and accurate to the hundredth. For example, if your answer is 10.2511%, then type in 10.25 Probability 0.05 0.25 0.40 0.30...
3. You have a risky portfolio that yields an expected rate of return of 15% with...
3. You have a risky portfolio that yields an expected rate of return of 15% with a standard deviation of 25%. Draw the CAL for an expected return/standard deviation diagram if the risk free rate is 5%. a. What is the slope of the CAL? b. If your coefficient of risk aversion is 5, how much should you invest in the risky portfolio? 4. A pension fund manager is considering three mutual funds. The first is a stock fund, the...
Tom has $10,000. He can invest the money in (1) a corporate bond, (2) a stock,...
Tom has $10,000. He can invest the money in (1) a corporate bond, (2) a stock, and (3) the risk-free T-bill. The table below provides these assets’ expected returns and standard deviations: Bond (D) Stock (E) T-Bill (F) Expected Return 5% 10% 2% Standard Deviation 10% 20% 0 The coefficient of correlation between the corporate bond and the stock (ρDE) is 30%. Tom has a risk aversion coefficient of A=5. To construct the optimal portfolio with two risky assets and...
Q1: A: You manage an equity fund with an expected risk premium of 9% and a...
Q1: A: You manage an equity fund with an expected risk premium of 9% and a standard deviation of 16%. The rate on T-bills is 4%. Your client chooses to invest $80,000 of her portfolio in your equity fund and $20,000 in T-bills. What is the expected return of your client's portfolio? Type percentage points and accurate to the hundredth. Q1: B: As in Question#1, what is the Sharpe ratio for the equity fund?
A pension fund manager is considering three mutual funds. The first is a stock fund the second is...
 A pension fund manager is considering three mutual funds. The first is a stock fund the second is a long-term government and corporate bond fund, and the third is a T-bill money market fund that yields a sure rate of 5.5%. The probability distributions of th risky funds are The following data apply to Problems 8-12. Standard Deviation 32% 23 Expected Return 15% Stock fund (S Bond fund (B) The correlation between the fund returns is.15 8. Tabulate and draw...
Need a help please. Thank you. A pension fund manager is considering three mutual funds. The first is a stock fun...
 Need a help please. Thank you.
A pension fund manager is considering three mutual funds. The first is a stock fund, the second is a long-term government and corporate bond fund, and the third is a T-bill money market fund that yields a sure rate of 4.7%. The probability distributions of the risky funds are: Expected Return Stock fund (S) Bond fund (B) Standard Deviation 37% 31% 17% 8% The correlation between the fund returns is 0.1065. What is the...
Need a help please. Thank you.
A pension fund manager is considering three mutual funds. The first is a stock fund, the second is a long-term government and corporate bond fund, and the third is a T-bill money market fund that yields a sure rate of 4.7%. The probability distributions of the risky funds are: Expected Return Stock fund (S) Bond fund (B) Standard Deviation 37% 31% 17% 8% The correlation between the fund returns is 0.1065. What is the...
You manage a risky portfolio with an expected return of 12% and a standard deviation of 24%. Assume that you can invest...
You manage a risky portfolio with an expected return of 12% and a standard deviation of 24%. Assume that you can invest and borrow at a risk-free rate of 3%, using T-bills. a. Draw the Capital Allocation Line (CAL) for this combination of risky portfolio and risk-free asset. What is the Sharpe ratio of the risky portfolio? b. Your client chooses to invest 50% of their funds into your risky portfolio and 50% risk-free. What is the expected return and...
Intro Assume that there are only two stocks in the economy, stock A and stock B. The risk-free asset has a return of 3%...
 Intro Assume that there are only two stocks in the economy, stock A and stock B. The risk-free asset has a return of 3%. The optimal risky portfolio, i.e., the portfolio with the highest Sharpe ratio, is given below: A BC Stock A Stock B Risk-free asset 2 Expected return 0.062 0.075 0.03 3 Variance 0.1521 0.0484 4 Standard deviation 0.39 0.22 5 Covariance 0.02574 D Optimal risky portfolio 8 Weights 9 Expected return 10 Variance 11 Standard deviation 12...
Need a help please. Thank you. A pension fund manager is considering three mutual funds. The...
 Need a help please. Thank you.
A pension fund manager is considering three mutual funds. The first is a stock fund, the second is a long-term government and corporate bond fund, and the third is a T-bill money market fund that yields a rate of 57%. The probability distribution of the risky funds is as follows: Expected Return Standard Deviation 47% 18% Stock fund (S) Bond fund (B) The correlation between the fund returns is 0.17. Solve numerically for the...
Need a help please. Thank you.
A pension fund manager is considering three mutual funds. The first is a stock fund, the second is a long-term government and corporate bond fund, and the third is a T-bill money market fund that yields a rate of 57%. The probability distribution of the risky funds is as follows: Expected Return Standard Deviation 47% 18% Stock fund (S) Bond fund (B) The correlation between the fund returns is 0.17. Solve numerically for the...
Answer all questions and show work using hand formulas only. Do NOT answer the question if...
 Answer all questions and show work using hand formulas only. Do
NOT answer the question if you cannot answer everything.
1.
2.
3.
TABLE 5.3 Risk and return of investments in major asset classes, 1927-2016 T-bills T-bonds Stocks Arithmetic average Risk premium Standard deviation max min 3.42 N/A 3.14 14.71 -0.02 5.51 2.08 8.14 38.07 -8.47 11.91 8.48 19.99 56.38 -43.73 Using Table 5.3 as your guide, what is your estimate of the expected annual HPR on the market index...
Answer all questions and show work using hand formulas only. Do
NOT answer the question if you cannot answer everything.
1.
2.
3.
TABLE 5.3 Risk and return of investments in major asset classes, 1927-2016 T-bills T-bonds Stocks Arithmetic average Risk premium Standard deviation max min 3.42 N/A 3.14 14.71 -0.02 5.51 2.08 8.14 38.07 -8.47 11.91 8.48 19.99 56.38 -43.73 Using Table 5.3 as your guide, what is your estimate of the expected annual HPR on the market index...
 The following questions are in order:
Question 1 1 pts The following data applies to Questions 1 to 3 Consider two risky assets: a stock fund and a bond fund with the following probability distributions. Scenario Severe recession Mild recession Normal growth Boom What is the expected return for the bond fund? Your answer should be in percentage points and accurate to the hundredth. For example, if your answer is 10.2511%, then type in 10.25 Probability 0.05 0.25 0.40 0.30...
The following questions are in order:
Question 1 1 pts The following data applies to Questions 1 to 3 Consider two risky assets: a stock fund and a bond fund with the following probability distributions. Scenario Severe recession Mild recession Normal growth Boom What is the expected return for the bond fund? Your answer should be in percentage points and accurate to the hundredth. For example, if your answer is 10.2511%, then type in 10.25 Probability 0.05 0.25 0.40 0.30...
 A pension fund manager is considering three mutual funds. The first is a stock fund the second is a long-term government and corporate bond fund, and the third is a T-bill money market fund that yields a sure rate of 5.5%. The probability distributions of th risky funds are The following data apply to Problems 8-12. Standard Deviation 32% 23 Expected Return 15% Stock fund (S Bond fund (B) The correlation between the fund returns is.15 8. Tabulate and draw...
 Need a help please. Thank you.
A pension fund manager is considering three mutual funds. The first is a stock fund, the second is a long-term government and corporate bond fund, and the third is a T-bill money market fund that yields a sure rate of 4.7%. The probability distributions of the risky funds are: Expected Return Stock fund (S) Bond fund (B) Standard Deviation 37% 31% 17% 8% The correlation between the fund returns is 0.1065. What is the...
Need a help please. Thank you.
A pension fund manager is considering three mutual funds. The first is a stock fund, the second is a long-term government and corporate bond fund, and the third is a T-bill money market fund that yields a sure rate of 4.7%. The probability distributions of the risky funds are: Expected Return Stock fund (S) Bond fund (B) Standard Deviation 37% 31% 17% 8% The correlation between the fund returns is 0.1065. What is the...
 Intro Assume that there are only two stocks in the economy, stock A and stock B. The risk-free asset has a return of 3%. The optimal risky portfolio, i.e., the portfolio with the highest Sharpe ratio, is given below: A BC Stock A Stock B Risk-free asset 2 Expected return 0.062 0.075 0.03 3 Variance 0.1521 0.0484 4 Standard deviation 0.39 0.22 5 Covariance 0.02574 D Optimal risky portfolio 8 Weights 9 Expected return 10 Variance 11 Standard deviation 12...
 Need a help please. Thank you.
A pension fund manager is considering three mutual funds. The first is a stock fund, the second is a long-term government and corporate bond fund, and the third is a T-bill money market fund that yields a rate of 57%. The probability distribution of the risky funds is as follows: Expected Return Standard Deviation 47% 18% Stock fund (S) Bond fund (B) The correlation between the fund returns is 0.17. Solve numerically for the...
Need a help please. Thank you.
A pension fund manager is considering three mutual funds. The first is a stock fund, the second is a long-term government and corporate bond fund, and the third is a T-bill money market fund that yields a rate of 57%. The probability distribution of the risky funds is as follows: Expected Return Standard Deviation 47% 18% Stock fund (S) Bond fund (B) The correlation between the fund returns is 0.17. Solve numerically for the...
 Answer all questions and show work using hand formulas only. Do
NOT answer the question if you cannot answer everything.
1.
2.
3.
TABLE 5.3 Risk and return of investments in major asset classes, 1927-2016 T-bills T-bonds Stocks Arithmetic average Risk premium Standard deviation max min 3.42 N/A 3.14 14.71 -0.02 5.51 2.08 8.14 38.07 -8.47 11.91 8.48 19.99 56.38 -43.73 Using Table 5.3 as your guide, what is your estimate of the expected annual HPR on the market index...
Answer all questions and show work using hand formulas only. Do
NOT answer the question if you cannot answer everything.
1.
2.
3.
TABLE 5.3 Risk and return of investments in major asset classes, 1927-2016 T-bills T-bonds Stocks Arithmetic average Risk premium Standard deviation max min 3.42 N/A 3.14 14.71 -0.02 5.51 2.08 8.14 38.07 -8.47 11.91 8.48 19.99 56.38 -43.73 Using Table 5.3 as your guide, what is your estimate of the expected annual HPR on the market index...
Most questions answered within 3 hours.
-
The extent to which assets are financed by borrowed funds and
other liabilities is indicated by:...
asked 49 minutes ago -
Explain in detail
Germany is the fifth largest economy
explain what goods and services Germany specializes...
asked 1 hour ago -
The density of platinum is 21.45 g/mL. If a cube of platinum
with a mass of...
asked 1 hour ago -
Accounts Receivable
Sales
A/R Posting
Extended Sales Invoice
Packing Slip
Compare invoice to packing slip 2...
asked 1 hour ago -
Michaella, age 23, is a full-time law student and is claimed by
her parents as a...
asked 1 hour ago -
Why are polymers not typically casted into products?
asked 1 hour ago -
When rolling a die 129 times, what is the probability of rolling
a 6 no more...
asked 1 hour ago -
4. A call option currently sells for $7.75. It has a strike
price of $85 and...
asked 1 hour ago -
1.
You need to prepare 10.0 liters of an acid aqueous solution with a
pH of...
asked 1 hour ago -
Along an aggregate supply curve, if the level of output is less
than the natural level...
asked 1 hour ago -
By 2025, annual consumption in emerging markets will total $30
trillion and contribute more than ________...
asked 1 hour ago -
At what point does reformation cease to be a viable option for
those who are oppressed...
asked 1 hour ago