
Homework Answers
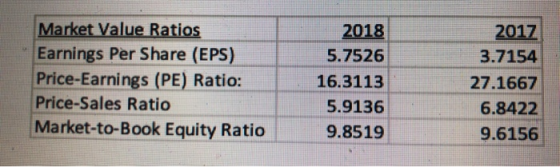
Looking at the above ratio, it can interpreted that company's EPS has grown substantially in the year 2018 as compared to 2017. This indicates higher profitability on the part of company. The EPS has increase by $2 which is a increase of more than 60% as compared to 2017 and hence a good sign for the company.
However, the PE ratio (calculated by dividing market price with EPS) of the company has gone down from 27 to 16 which shows that market has valued down the company and is paying less premium valuation to company as compared to 2017, this is not a good sign for company.
The price to sales ratio of the company has also seen a decline which means that company's market capitalization has became more as compared to its sales, which can be a further trigger for company's devaluation in future.
The market to book ratio depicts the premium pricing that market is paying to company's each share as compared to its value of each share as per books of the company. For example, if as per books, the company's share is $5 and market price of the company is quoting at $25, then M/B ratio comes at 5. In this case, there is not much change in the M/B ratio and it remains almost same. This shows company is paid a premium valuation and is continued in the year 2018 as well.
Add Answer to:
Please provide an interpretation based of off these Texas
Instrument’s Market Value Ratios in 2017-2018.
ii)...
Please provide an interpretation based of off these Texas Instrument’s Profitability Ratios in 2017-2018. ii) Please...
 Please provide an interpretation based of off these Texas
Instrument’s Profitability Ratios in 2017-2018.
ii) Please provide sufficient interpretations of the ratios and explain their change (or no change) from the year before, in a 1-2 paragraphs. If there's anything unusual or notable, please explain. Please be cautious about the signs on financial statement figures, especially on the income and cash flow statement. Some companies choose to report expense items as negative numbers because they get subtracted from the revenue...
Please provide an interpretation based of off these Texas
Instrument’s Profitability Ratios in 2017-2018.
ii) Please provide sufficient interpretations of the ratios and explain their change (or no change) from the year before, in a 1-2 paragraphs. If there's anything unusual or notable, please explain. Please be cautious about the signs on financial statement figures, especially on the income and cash flow statement. Some companies choose to report expense items as negative numbers because they get subtracted from the revenue...
Please provide an interpretation for Texas Instrument’s Liquidity Ratios in 2017-2018. ii) Please provide sufficient interpretations...
 Please provide an interpretation for Texas Instrument’s
Liquidity Ratios in 2017-2018.
ii) Please provide sufficient interpretations of the ratios and explain their change (or no change) from the year before, in a 1-2 paragraphs. If there's anything unusual or notable, please explain. Please be cautious about the signs on financial statement figures, especially on the income and cash flow statement. Some companies choose to report expense items as negative numbers because they get subtracted from the revenue to obtain the...
Please provide an interpretation for Texas Instrument’s
Liquidity Ratios in 2017-2018.
ii) Please provide sufficient interpretations of the ratios and explain their change (or no change) from the year before, in a 1-2 paragraphs. If there's anything unusual or notable, please explain. Please be cautious about the signs on financial statement figures, especially on the income and cash flow statement. Some companies choose to report expense items as negative numbers because they get subtracted from the revenue to obtain the...
Please provide an interpretation for Texas Instrument’s Leverage Ratios in 2017-2018. ii) Please provide sufficien...
 Please provide an interpretation for Texas Instrument’s
Leverage Ratios in 2017-2018.
ii) Please provide sufficient interpretations of the ratios and explain their change (or no change) from the year before, in a 1-2 paragraphs. If there's anything unusual or notable, please explain. Please be cautious about the signs on financial statement figures, especially on the income and cash flow statement. Some companies choose to report expense items as negative numbers because they get subtracted from the revenue to obtain the...
Please provide an interpretation for Texas Instrument’s
Leverage Ratios in 2017-2018.
ii) Please provide sufficient interpretations of the ratios and explain their change (or no change) from the year before, in a 1-2 paragraphs. If there's anything unusual or notable, please explain. Please be cautious about the signs on financial statement figures, especially on the income and cash flow statement. Some companies choose to report expense items as negative numbers because they get subtracted from the revenue to obtain the...
Please provide an interpretation based of off thse Texas Instrument’s Turnover Ratios in 2017-2018. ii) Please pro...
 Please provide an interpretation based of off thse Texas
Instrument’s Turnover Ratios in 2017-2018.
ii) Please provide sufficient interpretations of the ratios and explain their change (or no change) from the year before, in a 1-2 paragraphs. If there's anything unusual or notable, please explain. Please be cautious about the signs on financial statement figures, especially on the income and cash flow statement. Some companies choose to report expense items as negative numbers because they get subtracted from the revenue...
Please provide an interpretation based of off thse Texas
Instrument’s Turnover Ratios in 2017-2018.
ii) Please provide sufficient interpretations of the ratios and explain their change (or no change) from the year before, in a 1-2 paragraphs. If there's anything unusual or notable, please explain. Please be cautious about the signs on financial statement figures, especially on the income and cash flow statement. Some companies choose to report expense items as negative numbers because they get subtracted from the revenue...
Calculate the following ratios based on Wendy's 2017 and 2018 financial statements and comment on the...
 Calculate the following ratios based on Wendy's 2017 and 2018
financial statements and comment on the differences between FY 2017
and FY 2018.
Wendy's
FY 2017
FY 2018
Liquidity
Current Ratio:
Quick Ratio:
Comments on the companies' liquidity - what do the numbers
say?
Asset Management
Total Asset Turnover:
Avg Collection Period:
Comments on the companies' asset management - what do the numbers
say?
Debt Management
Total Debt to Total Assets:
Times Interest Earned:
Comments on the companies' debt management...
Calculate the following ratios based on Wendy's 2017 and 2018
financial statements and comment on the differences between FY 2017
and FY 2018.
Wendy's
FY 2017
FY 2018
Liquidity
Current Ratio:
Quick Ratio:
Comments on the companies' liquidity - what do the numbers
say?
Asset Management
Total Asset Turnover:
Avg Collection Period:
Comments on the companies' asset management - what do the numbers
say?
Debt Management
Total Debt to Total Assets:
Times Interest Earned:
Comments on the companies' debt management...
Calculate each of the ratios & provide a ratio analysis please & thank you!! For each...
 Calculate each of the ratios & provide a ratio
analysis please & thank you!!
For each ratio, provide a brief ratio analysis, trend analysis
and comparative analysis.
Indicator Analysis:
Briefly explain what the indicator means
Comparative Analysis
Compare WTRH 2017 with industry averages and explain how WTRH
did compared to other comparable hospitals.
Pic 1 is the data, pic 2&3 is the
assignment/question
Instructions: for each ratio, Provide a brief indicator
analysis and comparative analysis.
File Edit View 75% Insert...
Calculate each of the ratios & provide a ratio
analysis please & thank you!!
For each ratio, provide a brief ratio analysis, trend analysis
and comparative analysis.
Indicator Analysis:
Briefly explain what the indicator means
Comparative Analysis
Compare WTRH 2017 with industry averages and explain how WTRH
did compared to other comparable hospitals.
Pic 1 is the data, pic 2&3 is the
assignment/question
Instructions: for each ratio, Provide a brief indicator
analysis and comparative analysis.
File Edit View 75% Insert...
Please show the calculation steps, Thank you. 2017 2018 $12.17 Year-end common stock price Year-end shares...
 Please show the calculation steps, Thank
you.
2017 2018 $12.17 Year-end common stock price Year-end shares outstanding $6.00 250,000 100,000 40% Tax rate 40% Balance Sheets Prepare the following: Assets Cash and equivalents Short-term investments Accounts receivable Inventories Total current assets Gross Fixed Assets Less Accumulated Dep Net Fixed Assets Total Assets 2017 2018 $14,000 &718 $71,632 $878,000 S1,716,480 $2,680,112 $1,220,000 $7,282 1). Statement of Cash Flow 2018 $20,000 S632,160 $1,287,360 $1,946,802 $1,202,950 $263,160 2). Free Cash Flow available for...
Please show the calculation steps, Thank
you.
2017 2018 $12.17 Year-end common stock price Year-end shares outstanding $6.00 250,000 100,000 40% Tax rate 40% Balance Sheets Prepare the following: Assets Cash and equivalents Short-term investments Accounts receivable Inventories Total current assets Gross Fixed Assets Less Accumulated Dep Net Fixed Assets Total Assets 2017 2018 $14,000 &718 $71,632 $878,000 S1,716,480 $2,680,112 $1,220,000 $7,282 1). Statement of Cash Flow 2018 $20,000 S632,160 $1,287,360 $1,946,802 $1,202,950 $263,160 2). Free Cash Flow available for...
Please calculate the following ratios: Market value added Market to book ratio Return on Asset The...
Please calculate the following ratios: Market value added Market to book ratio Return on Asset The Home Depot, Inc. Cash Flow All numbers in thousands Period Ending 1/29/17 1/31/16 Net Income 7,957,000 7,009,000 Operating Activities, Cash Flows Provided By or Used In Depreciation 1,973,000 1,863,000 Adjustments To Net Income 267,000 100,000 Changes In Accounts Receivables -138,000 -181,000 Changes In Liabilities 654,000 1,151,000 Changes In Inventories -769,000 -546,000 Changes In Other Operating Activities -161,000 -23,000 Total Cash Flow From Operating Activities...
Oracle Corporation (ORCL) Income Statement All numbers in thousands Revenue 5/31/2018 5/31/2017 5/31/2016 5/31/2015 Total Revenue...
 Oracle Corporation (ORCL) Income Statement
All numbers in thousands
Revenue
5/31/2018
5/31/2017
5/31/2016
5/31/2015
Total Revenue
39,831,000
37,728,000
37,047,000
38,226,000
Cost of Revenue
8,081,000
7,469,000
7,479,000
7,532,000
Gross Profit
31,750,000
30,259,000
29,568,000
30,694,000
Operating Expenses
Research Development
6,091,000
6,159,000
5,787,000
5,524,000
Selling General and Administrative
9,720,000
9,373,000
9,039,000
8,732,000
Non Recurring
-
-
-
-
Others
-
-
-
-
Total Operating Expenses
25,512,000
24,452,000
23,943,000
23,937,000
Operating Income or Loss
14,319,000
13,276,000
13,104,000
14,289,000
Income from Continuing Operations
Total...
Oracle Corporation (ORCL) Income Statement
All numbers in thousands
Revenue
5/31/2018
5/31/2017
5/31/2016
5/31/2015
Total Revenue
39,831,000
37,728,000
37,047,000
38,226,000
Cost of Revenue
8,081,000
7,469,000
7,479,000
7,532,000
Gross Profit
31,750,000
30,259,000
29,568,000
30,694,000
Operating Expenses
Research Development
6,091,000
6,159,000
5,787,000
5,524,000
Selling General and Administrative
9,720,000
9,373,000
9,039,000
8,732,000
Non Recurring
-
-
-
-
Others
-
-
-
-
Total Operating Expenses
25,512,000
24,452,000
23,943,000
23,937,000
Operating Income or Loss
14,319,000
13,276,000
13,104,000
14,289,000
Income from Continuing Operations
Total...
please help with question 2 on the ratio analysis tab. I am attaching all tabs to...
 please help with question 2 on the ratio analysis tab.
I am attaching all tabs to help. thanks
A B C D E F G H I Instructions 1. Please enter the data from the previous tabs by clicking on the cell and typing and then clicking on the desired cell. For example to enter Net Income for 2018 type and go to the income statement tab and click on cell 127. 2. Complete the calculations. 3. Explain the significance...
please help with question 2 on the ratio analysis tab.
I am attaching all tabs to help. thanks
A B C D E F G H I Instructions 1. Please enter the data from the previous tabs by clicking on the cell and typing and then clicking on the desired cell. For example to enter Net Income for 2018 type and go to the income statement tab and click on cell 127. 2. Complete the calculations. 3. Explain the significance...
 Please provide an interpretation based of off these Texas
Instrument’s Profitability Ratios in 2017-2018.
ii) Please provide sufficient interpretations of the ratios and explain their change (or no change) from the year before, in a 1-2 paragraphs. If there's anything unusual or notable, please explain. Please be cautious about the signs on financial statement figures, especially on the income and cash flow statement. Some companies choose to report expense items as negative numbers because they get subtracted from the revenue...
Please provide an interpretation based of off these Texas
Instrument’s Profitability Ratios in 2017-2018.
ii) Please provide sufficient interpretations of the ratios and explain their change (or no change) from the year before, in a 1-2 paragraphs. If there's anything unusual or notable, please explain. Please be cautious about the signs on financial statement figures, especially on the income and cash flow statement. Some companies choose to report expense items as negative numbers because they get subtracted from the revenue...
 Please provide an interpretation for Texas Instrument’s
Liquidity Ratios in 2017-2018.
ii) Please provide sufficient interpretations of the ratios and explain their change (or no change) from the year before, in a 1-2 paragraphs. If there's anything unusual or notable, please explain. Please be cautious about the signs on financial statement figures, especially on the income and cash flow statement. Some companies choose to report expense items as negative numbers because they get subtracted from the revenue to obtain the...
Please provide an interpretation for Texas Instrument’s
Liquidity Ratios in 2017-2018.
ii) Please provide sufficient interpretations of the ratios and explain their change (or no change) from the year before, in a 1-2 paragraphs. If there's anything unusual or notable, please explain. Please be cautious about the signs on financial statement figures, especially on the income and cash flow statement. Some companies choose to report expense items as negative numbers because they get subtracted from the revenue to obtain the...
 Please provide an interpretation for Texas Instrument’s
Leverage Ratios in 2017-2018.
ii) Please provide sufficient interpretations of the ratios and explain their change (or no change) from the year before, in a 1-2 paragraphs. If there's anything unusual or notable, please explain. Please be cautious about the signs on financial statement figures, especially on the income and cash flow statement. Some companies choose to report expense items as negative numbers because they get subtracted from the revenue to obtain the...
Please provide an interpretation for Texas Instrument’s
Leverage Ratios in 2017-2018.
ii) Please provide sufficient interpretations of the ratios and explain their change (or no change) from the year before, in a 1-2 paragraphs. If there's anything unusual or notable, please explain. Please be cautious about the signs on financial statement figures, especially on the income and cash flow statement. Some companies choose to report expense items as negative numbers because they get subtracted from the revenue to obtain the...
 Please provide an interpretation based of off thse Texas
Instrument’s Turnover Ratios in 2017-2018.
ii) Please provide sufficient interpretations of the ratios and explain their change (or no change) from the year before, in a 1-2 paragraphs. If there's anything unusual or notable, please explain. Please be cautious about the signs on financial statement figures, especially on the income and cash flow statement. Some companies choose to report expense items as negative numbers because they get subtracted from the revenue...
Please provide an interpretation based of off thse Texas
Instrument’s Turnover Ratios in 2017-2018.
ii) Please provide sufficient interpretations of the ratios and explain their change (or no change) from the year before, in a 1-2 paragraphs. If there's anything unusual or notable, please explain. Please be cautious about the signs on financial statement figures, especially on the income and cash flow statement. Some companies choose to report expense items as negative numbers because they get subtracted from the revenue...
 Calculate the following ratios based on Wendy's 2017 and 2018
financial statements and comment on the differences between FY 2017
and FY 2018.
Wendy's
FY 2017
FY 2018
Liquidity
Current Ratio:
Quick Ratio:
Comments on the companies' liquidity - what do the numbers
say?
Asset Management
Total Asset Turnover:
Avg Collection Period:
Comments on the companies' asset management - what do the numbers
say?
Debt Management
Total Debt to Total Assets:
Times Interest Earned:
Comments on the companies' debt management...
Calculate the following ratios based on Wendy's 2017 and 2018
financial statements and comment on the differences between FY 2017
and FY 2018.
Wendy's
FY 2017
FY 2018
Liquidity
Current Ratio:
Quick Ratio:
Comments on the companies' liquidity - what do the numbers
say?
Asset Management
Total Asset Turnover:
Avg Collection Period:
Comments on the companies' asset management - what do the numbers
say?
Debt Management
Total Debt to Total Assets:
Times Interest Earned:
Comments on the companies' debt management...
 Calculate each of the ratios & provide a ratio
analysis please & thank you!!
For each ratio, provide a brief ratio analysis, trend analysis
and comparative analysis.
Indicator Analysis:
Briefly explain what the indicator means
Comparative Analysis
Compare WTRH 2017 with industry averages and explain how WTRH
did compared to other comparable hospitals.
Pic 1 is the data, pic 2&3 is the
assignment/question
Instructions: for each ratio, Provide a brief indicator
analysis and comparative analysis.
File Edit View 75% Insert...
Calculate each of the ratios & provide a ratio
analysis please & thank you!!
For each ratio, provide a brief ratio analysis, trend analysis
and comparative analysis.
Indicator Analysis:
Briefly explain what the indicator means
Comparative Analysis
Compare WTRH 2017 with industry averages and explain how WTRH
did compared to other comparable hospitals.
Pic 1 is the data, pic 2&3 is the
assignment/question
Instructions: for each ratio, Provide a brief indicator
analysis and comparative analysis.
File Edit View 75% Insert...
 Please show the calculation steps, Thank
you.
2017 2018 $12.17 Year-end common stock price Year-end shares outstanding $6.00 250,000 100,000 40% Tax rate 40% Balance Sheets Prepare the following: Assets Cash and equivalents Short-term investments Accounts receivable Inventories Total current assets Gross Fixed Assets Less Accumulated Dep Net Fixed Assets Total Assets 2017 2018 $14,000 &718 $71,632 $878,000 S1,716,480 $2,680,112 $1,220,000 $7,282 1). Statement of Cash Flow 2018 $20,000 S632,160 $1,287,360 $1,946,802 $1,202,950 $263,160 2). Free Cash Flow available for...
Please show the calculation steps, Thank
you.
2017 2018 $12.17 Year-end common stock price Year-end shares outstanding $6.00 250,000 100,000 40% Tax rate 40% Balance Sheets Prepare the following: Assets Cash and equivalents Short-term investments Accounts receivable Inventories Total current assets Gross Fixed Assets Less Accumulated Dep Net Fixed Assets Total Assets 2017 2018 $14,000 &718 $71,632 $878,000 S1,716,480 $2,680,112 $1,220,000 $7,282 1). Statement of Cash Flow 2018 $20,000 S632,160 $1,287,360 $1,946,802 $1,202,950 $263,160 2). Free Cash Flow available for...
 Oracle Corporation (ORCL) Income Statement
All numbers in thousands
Revenue
5/31/2018
5/31/2017
5/31/2016
5/31/2015
Total Revenue
39,831,000
37,728,000
37,047,000
38,226,000
Cost of Revenue
8,081,000
7,469,000
7,479,000
7,532,000
Gross Profit
31,750,000
30,259,000
29,568,000
30,694,000
Operating Expenses
Research Development
6,091,000
6,159,000
5,787,000
5,524,000
Selling General and Administrative
9,720,000
9,373,000
9,039,000
8,732,000
Non Recurring
-
-
-
-
Others
-
-
-
-
Total Operating Expenses
25,512,000
24,452,000
23,943,000
23,937,000
Operating Income or Loss
14,319,000
13,276,000
13,104,000
14,289,000
Income from Continuing Operations
Total...
Oracle Corporation (ORCL) Income Statement
All numbers in thousands
Revenue
5/31/2018
5/31/2017
5/31/2016
5/31/2015
Total Revenue
39,831,000
37,728,000
37,047,000
38,226,000
Cost of Revenue
8,081,000
7,469,000
7,479,000
7,532,000
Gross Profit
31,750,000
30,259,000
29,568,000
30,694,000
Operating Expenses
Research Development
6,091,000
6,159,000
5,787,000
5,524,000
Selling General and Administrative
9,720,000
9,373,000
9,039,000
8,732,000
Non Recurring
-
-
-
-
Others
-
-
-
-
Total Operating Expenses
25,512,000
24,452,000
23,943,000
23,937,000
Operating Income or Loss
14,319,000
13,276,000
13,104,000
14,289,000
Income from Continuing Operations
Total...
 please help with question 2 on the ratio analysis tab.
I am attaching all tabs to help. thanks
A B C D E F G H I Instructions 1. Please enter the data from the previous tabs by clicking on the cell and typing and then clicking on the desired cell. For example to enter Net Income for 2018 type and go to the income statement tab and click on cell 127. 2. Complete the calculations. 3. Explain the significance...
please help with question 2 on the ratio analysis tab.
I am attaching all tabs to help. thanks
A B C D E F G H I Instructions 1. Please enter the data from the previous tabs by clicking on the cell and typing and then clicking on the desired cell. For example to enter Net Income for 2018 type and go to the income statement tab and click on cell 127. 2. Complete the calculations. 3. Explain the significance...
Most questions answered within 3 hours.
-
Please help me with FLOWCHART and UML diagram for class,
thank you!
#include <iostream>
#include <fstream>...
asked 33 minutes ago -
3. Describe the “logic circuit” of the Lac operon. Which
proteins are bound or not to...
asked 34 minutes ago -
Ayesha’s adjusted gross income is $60,000 in 2019. She donated a
piece of artwork with a...
asked 41 minutes ago -
For Dijkstra’s shortest path algorithm:
a. Give the Big-O time for Dijkstra’s shortest path algorithm
and...
asked 53 minutes ago -
Phosphorus violates the 'octet rule' in biological molecules,
forming more covalent bonds than expected based on...
asked 56 minutes ago -
A 1.3 eV electron has a 10-4 probability of tunneling
through a 2.4 eV potential barrier....
asked 1 hour ago -
What is the one ingredient that is common to being successful
with all stakeholders?
profit
trust...
asked 1 hour ago -
Write an assembly language 32 bit program that reads in lines of
text by a .txt...
asked 1 hour ago -
what is the density ( in g/L) of hydrogen gas at 29 degrees C and a...
asked 1 hour ago -
5-6. You are considering three investment alternatives for some
spare cash: Old Reliable Corporation stock (A1),...
asked 1 hour ago -
Problem 16-02
Receivables Investment
Medwig Corporation has a DSO of 45 days. The company averages
$7,250...
asked 1 hour ago -
Mr. Brown hired Lowe's Maintenance Services Limited to repair
and paint the exterior wall of his...
asked 1 hour ago