Given this sample of 20 golf scores: 82 68 62 125 81 79 88 95 97 ...
Given this sample of 20 golf scores:
82 68 62 125
81 79 88 95
97 108
66 135 126 118
82 79 87 65
120 136
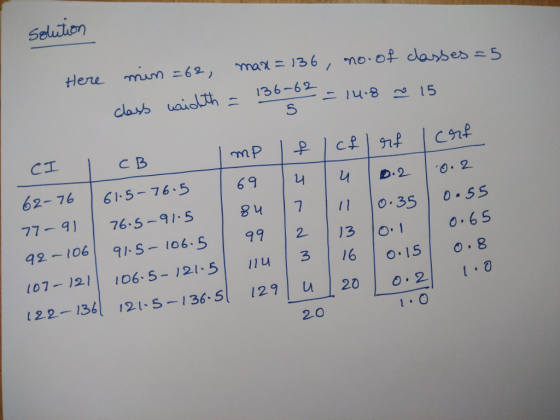
1. Using the golf score data, make a Frequency Distribution with 5
classes. (label: c, cb, mp, f, cf, rf, crf)
2. Then, construct a Histogram for the data.
Homework Answers
Here we have no.of classes 5
and from the data we can take minimum & maximum value
then find the class width

Add Answer to:
Given this sample of 20 golf scores:
82 68 62 125
81 79 88 95
97 ...
Data Set given for pulse rates 68 78 79 80 85 85 87 88 90 91...
Data Set given for pulse rates 68 78 79 80 85 85 87 88 90 91 92 95 96 97 100 102 103 110 114 125 What percentile is 97 located at?
2.) Below is a data set for a set of scores on a final exam: 63,...
 2.) Below is a data set for a set of scores on a final exam: 63, 88, 79, 92, 86, 87, 83, 78, 41, 67, 68, 76, 46, 81, 92,77, 84, 76, 70, 66. 77, 75, 98, 81, 82,81, 87, 78, 80, 60, 94, 79, 52, 82, 77, 61, 77, 70, 74, 61 Complete the following questions: (4 points total) (1 point each) a.) Create a frequency distribution by hand b.) Create a histogram by hand c.) Create a stem-and-leaf...
52 97 66 109 59 59 58 83 98 98 82 91 43 107 88 84...
52 97 66 109 59 59 58 83 98 98 82 91 43 107 88 84 91 73 112 87 91 137 73 108 64 96 119 87 Construct a grouped frequency distribution table (GFDT) for this data set. You want 10 classes with a "nice" class width. Your classes should be labeled using interval notation. Each class contains its lower class limit, and the lower class limits should all be multiples of the class width. In that the data...
Boats (tens of thousands) Manatees 66 55 65 38 69 34 67 49 74 42 75 59 78 53 84 69 81 82 87 79 90 81 94 93 92 74 98 67 99 78 102 91 100 73 98 91 97 97 93 82 8...
 Boats (tens of
thousands) Manatees
66 55
65 38
69 34
67 49
74 42
75 59
78 53
84 69
81 82
87 79
90 81
94 93
92 74
98 67
99 78
102 91
100 73
98 91
97 97
93 82
88 89
87 80
90 71
92 68
idrresponding numbe o ms for 880.000 registered Use the accompanying paired data consisting of registered boats (tens of thousands) and manatee fatalities from boat encounters. Let x...
Boats (tens of
thousands) Manatees
66 55
65 38
69 34
67 49
74 42
75 59
78 53
84 69
81 82
87 79
90 81
94 93
92 74
98 67
99 78
102 91
100 73
98 91
97 97
93 82
88 89
87 80
90 71
92 68
idrresponding numbe o ms for 880.000 registered Use the accompanying paired data consisting of registered boats (tens of thousands) and manatee fatalities from boat encounters. Let x...
Use the accompanying data set on the pulse rates (in beats per minute) of males to...
Use the accompanying data set on the pulse rates (in beats per minute) of males to complete parts (a) and (b) below. LOADING... Click the icon to view the pulse rates of males. a. Find the mean and standard deviation, and verify that the pulse rates have a distribution that is roughly normal. The mean of the pulse rates is 71.871.8 beats per minute. (Round to one decimal place as needed.) The standard deviation of the pulse rates is 12.212.2...
11. A random sample of 72 guinea pigs was taken and injected with infcabious bacteria. Their...
 11. A random sample of 72 guinea pigs was taken and injected with infcabious bacteria. Their survival times are: 43, 45, 53, 56, 56, 57, 58, 66, 67, 73, 74, 79, 80, 80, 81, 81, 81, 82, 83, 83, 84, 88, 89, 91, 91, 92, 92, 97, 99, 99, 100, 100, 101, 102, 102, 102, 103, 104, 107, 108, 109, 113, 114, 118, 121, 123, 126, 128, 137, 138, 139, 144, 145, 147, 156, 162, 174, 178, 179, 184, 191,...
11. A random sample of 72 guinea pigs was taken and injected with infectious bacteria. Their...
 11. A random sample of 72 guinea pigs was taken and injected with infectious bacteria. Their survival times are: 43, 45, 53, 56, 56, 57, 58, 66, 67, 73, 74, 79, 80, 80, 81, 81, 81, 82, 83, 83, 84, 88, 89, 91, 91, 92, 92, 97, 99, 99, 100, 100, 101, 102, 102, 102, 103, 104, 107, 108, 109, 113, 114, 118, 121, 123, 126, 128, 137, 138, 139, 144, 145, 147, 156, 162, 174, 178, 179, 184, 191,...
The following are the IQ scores of 60 students from a university. The histogram of the...
The following are the IQ scores of 60 students from a university. The histogram of the data is symmetric. 79 79 81 82 82 84 84 84 85 85 86 86 87 89 89 89 90 90 90 91 91 92 92 93 94 95 95 96 98 99 99 102 102 102 103 104 104 104 105 106 106 106 108 109 109 110 111 111 113 113 113 115 117 117 120 121 123 124 125 130 a....
How to solve this USING SAS EG? THANKS Automobile collisions: The number of collision claims (COL...
How to solve this USING SAS EG? THANKS Automobile collisions: The number of collision claims (COLLISION) reported for 1984-1986 cars are listed for 9 car categories: small two-door, midsized two-door, large two-door, small four-door, midsized four-door, large four-door, small station wagons and vans, midsized station wagons and vans, large station wagons and vans.. a. In excel convert the data to the format which is appropriate for SAS EG (the data should have 2 columns with names CARCLAS and CRASH). b....
Analyze the sample data given in the table below and provide reasons for changes in heart...
 Analyze the sample data given in the table below and provide reasons for changes in heart rate and Mean Arterial Pressure during lying down, exercise and holding breath as compared to sitting. Please type your answer and upload the document to the dropbox with the following file name format: Last name firstname HR MAP.docx Example Doe John HR MAP.docx The file should be uploaded by 11.59 pm Sunday 3/22/20. Late submissions will not be accepted. # 1 Sitting HR 7...
 2.) Below is a data set for a set of scores on a final exam: 63, 88, 79, 92, 86, 87, 83, 78, 41, 67, 68, 76, 46, 81, 92,77, 84, 76, 70, 66. 77, 75, 98, 81, 82,81, 87, 78, 80, 60, 94, 79, 52, 82, 77, 61, 77, 70, 74, 61 Complete the following questions: (4 points total) (1 point each) a.) Create a frequency distribution by hand b.) Create a histogram by hand c.) Create a stem-and-leaf...
 Boats (tens of
thousands) Manatees
66 55
65 38
69 34
67 49
74 42
75 59
78 53
84 69
81 82
87 79
90 81
94 93
92 74
98 67
99 78
102 91
100 73
98 91
97 97
93 82
88 89
87 80
90 71
92 68
idrresponding numbe o ms for 880.000 registered Use the accompanying paired data consisting of registered boats (tens of thousands) and manatee fatalities from boat encounters. Let x...
Boats (tens of
thousands) Manatees
66 55
65 38
69 34
67 49
74 42
75 59
78 53
84 69
81 82
87 79
90 81
94 93
92 74
98 67
99 78
102 91
100 73
98 91
97 97
93 82
88 89
87 80
90 71
92 68
idrresponding numbe o ms for 880.000 registered Use the accompanying paired data consisting of registered boats (tens of thousands) and manatee fatalities from boat encounters. Let x...
 11. A random sample of 72 guinea pigs was taken and injected with infcabious bacteria. Their survival times are: 43, 45, 53, 56, 56, 57, 58, 66, 67, 73, 74, 79, 80, 80, 81, 81, 81, 82, 83, 83, 84, 88, 89, 91, 91, 92, 92, 97, 99, 99, 100, 100, 101, 102, 102, 102, 103, 104, 107, 108, 109, 113, 114, 118, 121, 123, 126, 128, 137, 138, 139, 144, 145, 147, 156, 162, 174, 178, 179, 184, 191,...
 11. A random sample of 72 guinea pigs was taken and injected with infectious bacteria. Their survival times are: 43, 45, 53, 56, 56, 57, 58, 66, 67, 73, 74, 79, 80, 80, 81, 81, 81, 82, 83, 83, 84, 88, 89, 91, 91, 92, 92, 97, 99, 99, 100, 100, 101, 102, 102, 102, 103, 104, 107, 108, 109, 113, 114, 118, 121, 123, 126, 128, 137, 138, 139, 144, 145, 147, 156, 162, 174, 178, 179, 184, 191,...
 Analyze the sample data given in the table below and provide reasons for changes in heart rate and Mean Arterial Pressure during lying down, exercise and holding breath as compared to sitting. Please type your answer and upload the document to the dropbox with the following file name format: Last name firstname HR MAP.docx Example Doe John HR MAP.docx The file should be uploaded by 11.59 pm Sunday 3/22/20. Late submissions will not be accepted. # 1 Sitting HR 7...
Most questions answered within 3 hours.
-
If the K b of a weak base is 6.3 × 10 − 6 , what...
asked 2 minutes ago -
Which of the following is the minimum amount of moles of NaOH
that must be added...
asked 5 minutes ago -
Stories about organizational ________ provide important clues
about cultural values and norms.
a. myths
b. heroes...
asked 7 minutes ago -
Explain the criteria used in selecting a target market
BUS220 Retail Management, thank you!
asked 9 minutes ago -
Convert/Calculate the following:
Determine the identity of an elemental gas if 4.55 L weighing
35.4g, under...
asked 12 minutes ago -
Consider the equilibrium C(s)+ CO2(g) ⇌2 CO(g)
A 2.0 L flask contains a mixture of 0.10...
asked 11 minutes ago -
MATLAB
Part 1 – randFloatValue.m This function accepts two numbers,
lower and upper, and returns a...
asked 17 minutes ago -
You have been asked to hide prizes around your house for your
3-year old nephew. His...
asked 18 minutes ago -
Ammonia will decompose into nitrogen and hydrogen at high
temperature. An industrial chemist studying this reaction...
asked 25 minutes ago -
10. Complete the table below
only using hexadecimal numbers:
AL CODE
EBX
EAX
[EAX]
mov eax,...
asked 43 minutes ago -
trust is best established through the combination of ------and
------- .
1. magnanimity and justice
2....
asked 58 minutes ago -
Blood pressure is normally taken on the upper arm at the level
of the heart. Suppose,...
asked 56 minutes ago