
Homework Answers


Add Answer to:
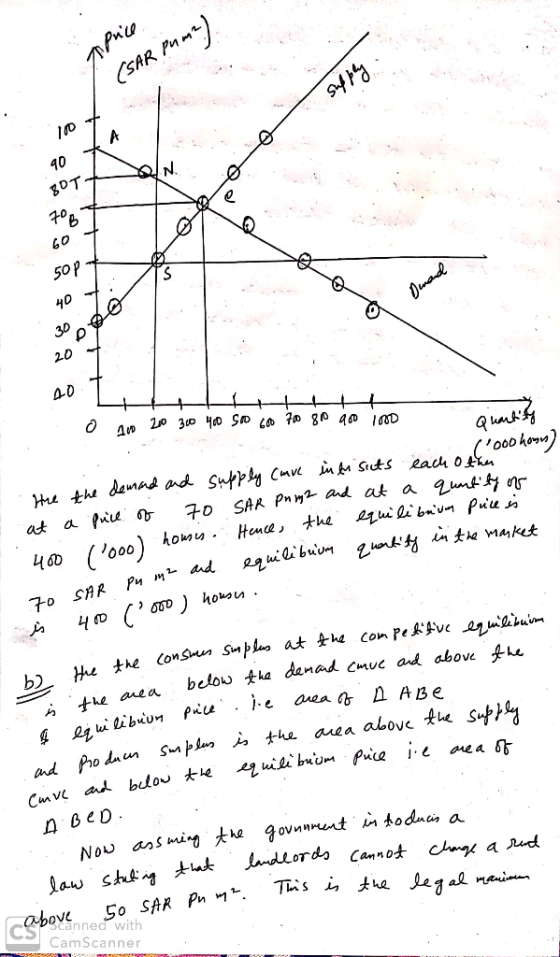
1.) Efficiency The table below shows the supply and demand balance for the rental housing market...
Consider the Bolivian market for lemons. The following graph shows the domestic demand and domestic supply...
 Consider the Bolivian market for lemons. The following graph shows the domestic demand and domestic supply curves for lemons in Bolivia. Suppose Bolivia's government currently does not allow international trade in lemons. Use the black point (plus symbol) to indicate the equilibrium price of a ton of lemons and the equilibrium quantity of lemons in Bolivia in the absence of international trade. Then, use the green triangle (triangle symbol) to shade the area representing consumer surplus in equilibrium. Finally, use...
Consider a market with demand and supply functions: Supply function: ? = 40? − 40 Demand...
Consider a market with demand and supply functions: Supply function: ? = 40? − 40 Demand function: ? = 200 − 20? a. Draw the demand-supply curves. Find equilibrium price and quantity. Find consumer surplus, producer surplus, and total surplus in the graph. b. Calculate exact size of consumer surplus, producer surplus, and total surplus, respectively. Welfare effects of a price control. The government sets a price floor at $5. c. Find the market price and quantity traded, and the...
Using the Supply and Demand Schedules to answer the following questions Table 1 Quantity Quantity Supplied...
 Using the Supply and Demand Schedules to answer the following questions Table 1 Quantity Quantity Supplied Demand Price 100 30 70 200 40 60 300 50 50 40 400 60 500 70 30 600 80 20 3a. Draw the Supply and Demand graph and label. Show the area for the shortage, surplus, and market equilibrium point demand curve to list inan of ft tw lis determinants of the supply curve to shift outward.
Using the Supply and Demand Schedules to...
Using the Supply and Demand Schedules to answer the following questions Table 1 Quantity Quantity Supplied Demand Price 100 30 70 200 40 60 300 50 50 40 400 60 500 70 30 600 80 20 3a. Draw the Supply and Demand graph and label. Show the area for the shortage, surplus, and market equilibrium point demand curve to list inan of ft tw lis determinants of the supply curve to shift outward.
Using the Supply and Demand Schedules to...
Consider the market for mountain bikes. The following graph shows the demand and supply for mountain...
 Consider the market for mountain bikes. The following graph shows the demand and supply for mountain bikes before the government imposes any taxes First, use the black point (plus symbol) to indicate the equilibrium price and quantity of mountain bikes in the absence of a tax. Then use the green point (triangle symbol) to shade the area representing total consumer surplus (CS) at the equilibrium price. Next, use the purple point (diamond symbol) to shade the area representing total producer...
Consider the Sudanese market for tangerines The following graph shows the domestic demand and domestic supply...
 Consider the Sudanese market for tangerines The following graph shows the domestic demand and domestic supply curves for tangerines in Sudan. Suppose Sudan's government currently does not allow international trade in tangerines Use the black point (plus symbol) to indicate the equilibrium price of a ton of tangerines and the equilibrium quantity of tangerines in Sudan in the absence of international trade. Then, use the green triangle (triangle symbol) to shade the area representing consumer surplus in equilibrium. Finally, use...
Consider the market for mountain bikes. The following graph shows the demand and supply for mountain...
 Consider the market for mountain bikes. The following graph shows the demand and supply for mountain bikes before the government imposes any taxes. First, use the black point (plus symbol) to indicate the equilbrium price and quantity of mountain bikes in the absence of a tex. Then use the green point (triangle symbol) to shade the area representing total consumer surplus (CS) at the equilbrium price. Next, use the purple point (dlamond symbol) to shade the area representing total producer...
8. Total economie surplus The following diagram shows supply and demand in the market for smartphones...
 8. Total economie surplus The following diagram shows supply and demand in the market for smartphones Use the black point (plus symbol) to indl the equilibrium price and quantity of smartphones. Then use the green point (triangle symbol) to fill area representing consumer surplus, and use the purple point (diamond symbol) to fill the area representing producer surplus. Demand Equilibrium Consumer Surplus PRICE (Dollars per phone) Producer Surplus 0 40 320 350 400 80 120 160 200 240 280 QUANTITY (Millions of phones)...
2. Taxes and welfare Consider the market for mountain bikes. The following graph shows the demand...
 2. Taxes and welfare Consider the market for mountain bikes. The following graph shows the demand and supply for mountain bikes before the government imposes any taxes. First, use the black point (plus symbol) to indicate the equilibrium price and quantity of mountain bikes in the absence of a tax. Then use the green point (triangle symbol) to shade the area representing total consumer surplus (CS) at the equilibrium price. Next, use the purple point (diamond symbol) to shade the...
.1. The table below shows the demand for and supply of rental housing in Windhoek. The...
 .1. The table below shows the demand for and supply of rental housing in Windhoek. The city govemment is considering imposing a rent ceiling of NS700 a month. Help the government to analyze the effects of the proposed rent ceiling. dollars per month) (units per month units per month) 500 600 700 800 900 1,200 1,000 800 600 400 200 100 0 100 Draw the demand and supply curves. With no rent ceiling, what is the rent and how many...
11. Total welfare The following graph shows supply and demand in the market for computer keyboards....
 11. Total welfare The following graph shows supply and demand in the market for computer keyboards. Use the black point (cross symbol) to indicate the equilibrium price and quantity of computer keyboards. Then use the green point (triangle symbol) to fill the area representing consumer surplus, and use the purple point (diamond symbol) to fill the area representing producer surplus. Demand Equilibrium A Consumer Surplus PRICE (Dollars per keyboard) Producer Surplus Supply 0 10 90 100 20 30 40 50...
 Consider the Bolivian market for lemons. The following graph shows the domestic demand and domestic supply curves for lemons in Bolivia. Suppose Bolivia's government currently does not allow international trade in lemons. Use the black point (plus symbol) to indicate the equilibrium price of a ton of lemons and the equilibrium quantity of lemons in Bolivia in the absence of international trade. Then, use the green triangle (triangle symbol) to shade the area representing consumer surplus in equilibrium. Finally, use...
 Using the Supply and Demand Schedules to answer the following questions Table 1 Quantity Quantity Supplied Demand Price 100 30 70 200 40 60 300 50 50 40 400 60 500 70 30 600 80 20 3a. Draw the Supply and Demand graph and label. Show the area for the shortage, surplus, and market equilibrium point demand curve to list inan of ft tw lis determinants of the supply curve to shift outward.
Using the Supply and Demand Schedules to...
Using the Supply and Demand Schedules to answer the following questions Table 1 Quantity Quantity Supplied Demand Price 100 30 70 200 40 60 300 50 50 40 400 60 500 70 30 600 80 20 3a. Draw the Supply and Demand graph and label. Show the area for the shortage, surplus, and market equilibrium point demand curve to list inan of ft tw lis determinants of the supply curve to shift outward.
Using the Supply and Demand Schedules to...
 Consider the market for mountain bikes. The following graph shows the demand and supply for mountain bikes before the government imposes any taxes First, use the black point (plus symbol) to indicate the equilibrium price and quantity of mountain bikes in the absence of a tax. Then use the green point (triangle symbol) to shade the area representing total consumer surplus (CS) at the equilibrium price. Next, use the purple point (diamond symbol) to shade the area representing total producer...
 Consider the Sudanese market for tangerines The following graph shows the domestic demand and domestic supply curves for tangerines in Sudan. Suppose Sudan's government currently does not allow international trade in tangerines Use the black point (plus symbol) to indicate the equilibrium price of a ton of tangerines and the equilibrium quantity of tangerines in Sudan in the absence of international trade. Then, use the green triangle (triangle symbol) to shade the area representing consumer surplus in equilibrium. Finally, use...
 Consider the market for mountain bikes. The following graph shows the demand and supply for mountain bikes before the government imposes any taxes. First, use the black point (plus symbol) to indicate the equilbrium price and quantity of mountain bikes in the absence of a tex. Then use the green point (triangle symbol) to shade the area representing total consumer surplus (CS) at the equilbrium price. Next, use the purple point (dlamond symbol) to shade the area representing total producer...
 8. Total economie surplus The following diagram shows supply and demand in the market for smartphones Use the black point (plus symbol) to indl the equilibrium price and quantity of smartphones. Then use the green point (triangle symbol) to fill area representing consumer surplus, and use the purple point (diamond symbol) to fill the area representing producer surplus. Demand Equilibrium Consumer Surplus PRICE (Dollars per phone) Producer Surplus 0 40 320 350 400 80 120 160 200 240 280 QUANTITY (Millions of phones)...
 2. Taxes and welfare Consider the market for mountain bikes. The following graph shows the demand and supply for mountain bikes before the government imposes any taxes. First, use the black point (plus symbol) to indicate the equilibrium price and quantity of mountain bikes in the absence of a tax. Then use the green point (triangle symbol) to shade the area representing total consumer surplus (CS) at the equilibrium price. Next, use the purple point (diamond symbol) to shade the...
 .1. The table below shows the demand for and supply of rental housing in Windhoek. The city govemment is considering imposing a rent ceiling of NS700 a month. Help the government to analyze the effects of the proposed rent ceiling. dollars per month) (units per month units per month) 500 600 700 800 900 1,200 1,000 800 600 400 200 100 0 100 Draw the demand and supply curves. With no rent ceiling, what is the rent and how many...
 11. Total welfare The following graph shows supply and demand in the market for computer keyboards. Use the black point (cross symbol) to indicate the equilibrium price and quantity of computer keyboards. Then use the green point (triangle symbol) to fill the area representing consumer surplus, and use the purple point (diamond symbol) to fill the area representing producer surplus. Demand Equilibrium A Consumer Surplus PRICE (Dollars per keyboard) Producer Surplus Supply 0 10 90 100 20 30 40 50...
Most questions answered within 3 hours.
-
This is a basic java program where you convert units using only
loops, control statements and...
asked 37 seconds from now -
A sample survey at a supermarket showed that 204 of 300 shoppers
regularly use cents-off coupons....
asked 44 minutes ago -
1. Find the area under the standard normal curve that lies
outside the interval between z=...
asked 16 minutes ago -
In ________ mode, the interpreter reads the contents of a file
that contains Python statements and...
asked 31 minutes ago -
1.
The second-order rate constant for self-reaction of hydroxyl
radicals
2 OH → H2O + O...
asked 21 minutes ago -
What is the most important factor leading to improved resource
efficiency over the long run?
asked 18 minutes ago -
Defend the effectiveness of teamwork in an organization.
(Use no more than 30 words)
asked 19 minutes ago -
Promotional strategies can assist in moving a product through
the channel of distribution. (a) Briefly explain...
asked 19 minutes ago -
Discuss why new and improved security measures are not enough to
stop online crime, What is...
asked 25 minutes ago -
A person whose weight is 516 N is being pulled up vertically by
a rope from...
asked 38 minutes ago -
A long straight wire lies along the x axis carries a current of
15 amps in...
asked 35 minutes ago -
Suppose you work hard building your business and end up earning
zero economic profit for the...
asked 37 minutes ago