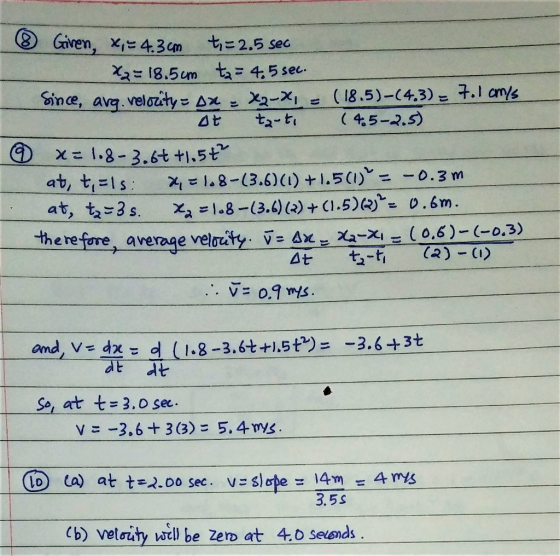
8. A student rolls a marble alongside a meterstick to measure
its velocity. At t1 = -2.5 s, its position is x1 = 4.3 cm, and at
t2 = 4.5 s it is at x2 = 18.5 cm. Determine its average velocity
during this time interval.
9. The position of a ball rolling along a straight line is given by
? = 1.8−3.6? +1.5?2, where x is in meters and t is in seconds.
Determine the average velocity of the ball over the interval t =
1.0 s to 3.0 s. Determine the instantaneous velocity at t = 3.0
s.
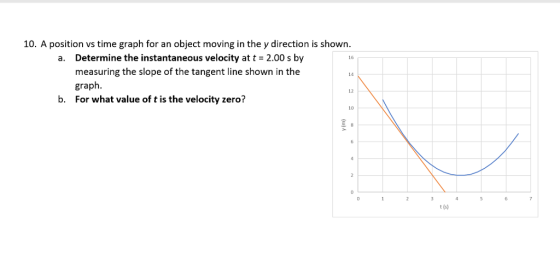
10. A position vs time graph for an object moving in the y direction is shown. a. Determine the instantaneous velocity at t = 2.00 s by measuring the slope of the tangent line shown in the graph. b. For what value of t is the velocity zero?
Homework Answers
Alright Dude, If that worked for you... dont forget to give THUMBS UP.(that will work for me!)
If I missed something feel free to leave a comment.
atleast before giving downvote.
and, Thanks for using homeworklib- Smarter way to study.
Add Answer to:
8. A student rolls a marble alongside a meterstick to measure
its velocity. At t1 =...
A position-time graph for a particle moving along the x axis is shown in the figure below.
 A position-time graph for a particle moving along the x axis is shown in the figure below.(a) Find the average velocity in the time interval t = 1.00 s to t = 4.00 s. (Indicate the direction with the sign of your answer.) (b) Determine the instantaneous velocity at t = 2.00 s by measuring the slope of the tangent line shown in the graph touches the curve. Indicate the direction with the sign of your answer.)(c) At what value of...
A position-time graph for a particle moving along the x axis is shown in the figure...
 A position-time graph for a particle moving along the x axis is shown in the figure below x (m) 12 10 8 6 t (s) 02 3 4 5 6 (a) Find the average velocity in the time intervalt2.00s tot-4.00s. (Indicate the direction with the sign of your answer) m/s (b) Determine the instantaneous velocity at t = 2.00 s by measuring the slope of the tangent line shown in the graph. (Note that t Indicate the direction with the...
Please explain all the steps needed to complete this problem. Thank you for your time. A...
 Please explain all the steps
needed to complete this problem.
Thank you for your time.
A position-time graph for a particle moving along the x axis is shown in the figure. The divisions along the horizontal axis represent 1.75 s and the divisions along the vertical axis represent 3.0 m (a) Find the average velocity in the time interval t = 5.25 s to t = 14.00 s m/s (b) Determine the instantaneous velocity at t = 7.00 s (where...
Please explain all the steps
needed to complete this problem.
Thank you for your time.
A position-time graph for a particle moving along the x axis is shown in the figure. The divisions along the horizontal axis represent 1.75 s and the divisions along the vertical axis represent 3.0 m (a) Find the average velocity in the time interval t = 5.25 s to t = 14.00 s m/s (b) Determine the instantaneous velocity at t = 7.00 s (where...
My Notes O Ask Your A position-time graph for a particle moving along the x axis...
 My Notes O Ask Your A position-time graph for a particle moving along the x axis is shown in the figure below. x (m) 12 10F レ (a) Find the average velocity in the time interval t 2.00 s tof 3.50 s. (Indicate the direction with the sign of your answer.) Your response differs from the correct answer by more than 10%. Double check your calculations. m/s (b) Determine the instantaneous velocity at t-2.00 s by measuring the slope of...
A 51.0g Super Bal traveling at 28.5 m/'s bounces off a brick wall and rebounds at...
 A 51.0g Super Bal traveling at 28.5 m/'s bounces off a brick wall and rebounds at 19.0 m/s. A high-speed camera records this event. If the ball is in contact with the wall for 3.45 ms, what is the magnitude of the average acceleration of the ball during this time interval? 10700 Average acceleration is the change in velocity divided by the time interval. m/s Need Help? hud Yaehs A position-time graph for a particle moving along the x axis...
a) Find the average velocity in the time interval t = 1.00 s to t =...
 a) Find the average velocity in the time interval
t = 1.00 s to t = 3.00
s.(Indicate the direction with the sign of your answer.)
b) Determine the instantaneous velocity at t = 2.00 s by
measuring the slope of the tangent line shown in the graph. (Note
that t = 2.00 s is where the tangent line touches the curve.
Indicate the direction with the sign of your answer.)
c) I have answered.
With question number 2, my...
a) Find the average velocity in the time interval
t = 1.00 s to t = 3.00
s.(Indicate the direction with the sign of your answer.)
b) Determine the instantaneous velocity at t = 2.00 s by
measuring the slope of the tangent line shown in the graph. (Note
that t = 2.00 s is where the tangent line touches the curve.
Indicate the direction with the sign of your answer.)
c) I have answered.
With question number 2, my...
Please show all your work. 5) Acceleration is to velocity as velocity is to position . aaux"# r where vr įs th...
 Please show all your work.
5) Acceleration is to velocity as velocity is to position . aaux"# r where vr įs the instantaneous velocity. So the average acceleration is about how rapidly the instantaneous velocity is changing, and the sign tells about the direction of the change. At For the pendulum, you made estimates of the instantaneous velocity for ←2.05[s] and t= 2.5%]. Also, the average speed and average velocity estimates that you made at other times may be reasonable...
Please show all your work.
5) Acceleration is to velocity as velocity is to position . aaux"# r where vr įs the instantaneous velocity. So the average acceleration is about how rapidly the instantaneous velocity is changing, and the sign tells about the direction of the change. At For the pendulum, you made estimates of the instantaneous velocity for ←2.05[s] and t= 2.5%]. Also, the average speed and average velocity estimates that you made at other times may be reasonable...
need help on this graph Physies 195 - Straight-line kinematics Data: Dot period=1/10s: the time interval...
 need help on this graph
Physies 195 - Straight-line kinematics Data: Dot period=1/10s: the time interval between dots is 0.100 corrected values] 15 16 Xc (cm) te(s) 6 7 0 12 3 14. X(cm) t(s) đa (cm) | V (cm/s) 0 0 2.18 0.1002 .182 .0 4.890.200 12.7127.00 2. 5 0.30 3.67 36.70 12.88 o.quo 4.32 430 f 9.95 O S 10 .20 zich were 1 1 tbalo 30,56 38.0 74.50 46.43 0.900 8.8 84.43 55-25 88.00 1101.30 65.39 1.100...
need help on this graph
Physies 195 - Straight-line kinematics Data: Dot period=1/10s: the time interval between dots is 0.100 corrected values] 15 16 Xc (cm) te(s) 6 7 0 12 3 14. X(cm) t(s) đa (cm) | V (cm/s) 0 0 2.18 0.1002 .182 .0 4.890.200 12.7127.00 2. 5 0.30 3.67 36.70 12.88 o.quo 4.32 430 f 9.95 O S 10 .20 zich were 1 1 tbalo 30,56 38.0 74.50 46.43 0.900 8.8 84.43 55-25 88.00 1101.30 65.39 1.100...
7:32 0 . 18% 5 Col20628 il y Pow To (a) The graph below plots the...
 7:32 0 . 18% 5 Col20628 il y Pow To (a) The graph below plots the position versus time for an object moving in one dimension along the x direction. What is the speed (magnitude of velocity) of the object at. The graph plots position vs. time, not velocity vs. time. To find velocity, think about the definition of instantaneous velocity and how it is related to position. Notice the graph is a straight line from .. . Can you...
3. You throw a ball into the air, and catch it 5s later at the same...
 3. You throw a ball into the air, and catch it 5s later at the same height at which it was thrown. (4 marks) a) What was the initial velocity of the ball? b) How high did the ball go? 4. The following graph represents the position of an object, moving along a horizontal line as a function of time. The positive direction is East and negative direction is West. Express all answers to two significant figures. (5 marks) Position...
 A position-time graph for a particle moving along the x axis is shown in the figure below x (m) 12 10 8 6 t (s) 02 3 4 5 6 (a) Find the average velocity in the time intervalt2.00s tot-4.00s. (Indicate the direction with the sign of your answer) m/s (b) Determine the instantaneous velocity at t = 2.00 s by measuring the slope of the tangent line shown in the graph. (Note that t Indicate the direction with the...
 Please explain all the steps
needed to complete this problem.
Thank you for your time.
A position-time graph for a particle moving along the x axis is shown in the figure. The divisions along the horizontal axis represent 1.75 s and the divisions along the vertical axis represent 3.0 m (a) Find the average velocity in the time interval t = 5.25 s to t = 14.00 s m/s (b) Determine the instantaneous velocity at t = 7.00 s (where...
Please explain all the steps
needed to complete this problem.
Thank you for your time.
A position-time graph for a particle moving along the x axis is shown in the figure. The divisions along the horizontal axis represent 1.75 s and the divisions along the vertical axis represent 3.0 m (a) Find the average velocity in the time interval t = 5.25 s to t = 14.00 s m/s (b) Determine the instantaneous velocity at t = 7.00 s (where...
 My Notes O Ask Your A position-time graph for a particle moving along the x axis is shown in the figure below. x (m) 12 10F レ (a) Find the average velocity in the time interval t 2.00 s tof 3.50 s. (Indicate the direction with the sign of your answer.) Your response differs from the correct answer by more than 10%. Double check your calculations. m/s (b) Determine the instantaneous velocity at t-2.00 s by measuring the slope of...
 A 51.0g Super Bal traveling at 28.5 m/'s bounces off a brick wall and rebounds at 19.0 m/s. A high-speed camera records this event. If the ball is in contact with the wall for 3.45 ms, what is the magnitude of the average acceleration of the ball during this time interval? 10700 Average acceleration is the change in velocity divided by the time interval. m/s Need Help? hud Yaehs A position-time graph for a particle moving along the x axis...
 a) Find the average velocity in the time interval
t = 1.00 s to t = 3.00
s.(Indicate the direction with the sign of your answer.)
b) Determine the instantaneous velocity at t = 2.00 s by
measuring the slope of the tangent line shown in the graph. (Note
that t = 2.00 s is where the tangent line touches the curve.
Indicate the direction with the sign of your answer.)
c) I have answered.
With question number 2, my...
a) Find the average velocity in the time interval
t = 1.00 s to t = 3.00
s.(Indicate the direction with the sign of your answer.)
b) Determine the instantaneous velocity at t = 2.00 s by
measuring the slope of the tangent line shown in the graph. (Note
that t = 2.00 s is where the tangent line touches the curve.
Indicate the direction with the sign of your answer.)
c) I have answered.
With question number 2, my...
 Please show all your work.
5) Acceleration is to velocity as velocity is to position . aaux"# r where vr įs the instantaneous velocity. So the average acceleration is about how rapidly the instantaneous velocity is changing, and the sign tells about the direction of the change. At For the pendulum, you made estimates of the instantaneous velocity for ←2.05[s] and t= 2.5%]. Also, the average speed and average velocity estimates that you made at other times may be reasonable...
Please show all your work.
5) Acceleration is to velocity as velocity is to position . aaux"# r where vr įs the instantaneous velocity. So the average acceleration is about how rapidly the instantaneous velocity is changing, and the sign tells about the direction of the change. At For the pendulum, you made estimates of the instantaneous velocity for ←2.05[s] and t= 2.5%]. Also, the average speed and average velocity estimates that you made at other times may be reasonable...
 need help on this graph
Physies 195 - Straight-line kinematics Data: Dot period=1/10s: the time interval between dots is 0.100 corrected values] 15 16 Xc (cm) te(s) 6 7 0 12 3 14. X(cm) t(s) đa (cm) | V (cm/s) 0 0 2.18 0.1002 .182 .0 4.890.200 12.7127.00 2. 5 0.30 3.67 36.70 12.88 o.quo 4.32 430 f 9.95 O S 10 .20 zich were 1 1 tbalo 30,56 38.0 74.50 46.43 0.900 8.8 84.43 55-25 88.00 1101.30 65.39 1.100...
need help on this graph
Physies 195 - Straight-line kinematics Data: Dot period=1/10s: the time interval between dots is 0.100 corrected values] 15 16 Xc (cm) te(s) 6 7 0 12 3 14. X(cm) t(s) đa (cm) | V (cm/s) 0 0 2.18 0.1002 .182 .0 4.890.200 12.7127.00 2. 5 0.30 3.67 36.70 12.88 o.quo 4.32 430 f 9.95 O S 10 .20 zich were 1 1 tbalo 30,56 38.0 74.50 46.43 0.900 8.8 84.43 55-25 88.00 1101.30 65.39 1.100...
 7:32 0 . 18% 5 Col20628 il y Pow To (a) The graph below plots the position versus time for an object moving in one dimension along the x direction. What is the speed (magnitude of velocity) of the object at. The graph plots position vs. time, not velocity vs. time. To find velocity, think about the definition of instantaneous velocity and how it is related to position. Notice the graph is a straight line from .. . Can you...
 3. You throw a ball into the air, and catch it 5s later at the same height at which it was thrown. (4 marks) a) What was the initial velocity of the ball? b) How high did the ball go? 4. The following graph represents the position of an object, moving along a horizontal line as a function of time. The positive direction is East and negative direction is West. Express all answers to two significant figures. (5 marks) Position...
Most questions answered within 3 hours.
-
A 8.15- g bullet from a 9-mm pistol has a velocity of 366.0 m/s.
It strikes...
asked 1 hour ago -
The outstanding bonds of Alpha Extracts have a yield to maturity
of 7.4 percent and a...
asked 1 hour ago -
The Problem: The Case of the Harmonizing Vacations
Your CEO is exploring partnering with a European...
asked 2 hours ago -
A chemical equation is balanced by adding coefficients in front
of some formulas so that the...
asked 2 hours ago -
From the literature (reference your sources): What are the
lattice parameters of calcite and aragonite? Why...
asked 3 hours ago -
Your system is rejecting the question am asking which is
preceded by a case study. It...
asked 3 hours ago -
3. On January 2, 2000, Larry creates a trust with himself as
trustee. Larry as trustee...
asked 3 hours ago -
A member of the volleyball team spikes the ball. During this
process, she changes the velocity...
asked 3 hours ago -
Are adult gamers less likely to use a gaming console (Xbox,
PlayStation, Wii, etc...) than teen...
asked 4 hours ago -
The University of
Texas recently reported that 43% of college students aged 18-24
would spend their...
asked 4 hours ago -
The length of stay at a specific emergency department in
Phoenix, Arizona, in 2009 had a...
asked 3 hours ago -
. Please give the mechanism for this type of problem. Step by
Step
The toxin that...
asked 3 hours ago