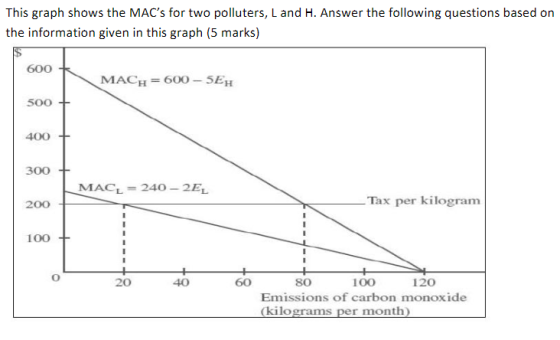
a) Suppose the socially efficient emissions level is 100 kg of
carbon monoxide per month. If a uniform emissions tax of $200 per
kg is set,what will be L’s private compliance cost and what will be
H’s private compliance cost?
b) Suppose that, instead of a uniform emissions tax, a uniform
standard was set at 50 kg. per month per polluter.What will be L’s
private cost to comply with this standard? What will be H’s private
cost to comply with the standard?
c) Would the polluters prefer the uniform emissions tax or the
uniform standard?
Homework Answers
A) L will only emit 20 kg Co.
And it's complaince cost=1/2*(120-20)*200+200*20=100*100+4000=14,000
H will emit 80 kg Co
And it's complaince cost=1/2*(120-80)*200+200*80=100*40+16,000=20,000
B)MAC(L) at E(50)=240-2*50=140
So compliance cost of firm L=1/2*140*(120-50)=70*70=4900
MAC(H) at E(50)=600-5*50=350
So compliance cost firm H=1/2*350*(120-50)=350*35=12,250
C)The compliance cost each firm is higher with emission tax compare to uniform standard,so both firms will prefer uniform standard.
Add Answer to:
a) Suppose the socially efficient emissions level is 100 kg of
carbon monoxide per month. If...
Consider the following diagram. Suppose MDU represents marginal damages in Toronto and MDR represents marginal damages...
 Consider the following diagram. Suppose MDU represents marginal
damages in Toronto and MDR represents marginal damages in Thunder
Bay caused by emissions of carbon monoxide.
Suppose the regulator imposes a uniform standard of 50
kg of emissions in each city. In the above diagram, identify the
areas representing the net social loss from under-control in the
urban area and the net social loss from over-control in the rural
area. Compute the dollar values of these areas.
MDu 10Eu 600 500...
Consider the following diagram. Suppose MDU represents marginal
damages in Toronto and MDR represents marginal damages in Thunder
Bay caused by emissions of carbon monoxide.
Suppose the regulator imposes a uniform standard of 50
kg of emissions in each city. In the above diagram, identify the
areas representing the net social loss from under-control in the
urban area and the net social loss from over-control in the rural
area. Compute the dollar values of these areas.
MDu 10Eu 600 500...
Let E represent global emissions of CO2 from fossil fuel burning and cement Suppose that the...
 Let E represent global emissions of CO2 from fossil fuel burning and cement Suppose that the marginal private surplus from emissions (the private surplus from each additional small unit of emissions) is described by the following function where E is the argument. (E 864-24*E The marginal external cost (the cost of an additional small unit of emissions) to the third parties is described by the following function. McEtemal(E) - 216 Units for MSrivae and MCEteal are S/t CO2 (where t...
PRICE (Dollars per ton of paper) Consider the market for paper. Suppose that a paper factory...
 PRICE (Dollars per ton of paper) Consider the market for paper. Suppose that a paper factory dumps toxic waste into a nearby river, creating a negative externality for those living downstream from the factory. Producing an additional ton of paper imposes a constant external cost of $450 per ton. The following graph shows the demand (private value) curve and the supply (private cost) curve for paper. Use the purple points (diamond symbol) to plot the social cost curve when the...
Part II: Market Failure in the Passenger Airline Industry and Policy (30%) For full marks: Craphs:...
 Part II: Market Failure in the Passenger Airline Industry and Policy (30%) For full marks: Craphs: Plot graphs to scale on graph paper by hand, include a figure number, title, and label all axis including correct units, be neat and tidy and put in order in the assignment. Introduce the graph with a sentence before it. 2) For algebra, use short sentences to guide the reader (SSTGR) through your work. Example: "To find the perfectly competitive market equilibrium global daily...
Part II: Market Failure in the Passenger Airline Industry and Polis ) Farfalla Pleash paper and...
 Part II: Market Failure in the Passenger Airline Industry and Polis ) Farfalla Pleash paper and clude af a ti certi, bet tidy and put in ander in the mot h er 2) Forre the SSTGRE "To find the perfectly comparti l y o பழmal வான வடிவான மழைமை in tamil sis pl s. மன quantity back in the the M M C find they Check with other are a Theme a rcis Share of crude oil and the A dalid...
 Consider the following diagram. Suppose MDU represents marginal
damages in Toronto and MDR represents marginal damages in Thunder
Bay caused by emissions of carbon monoxide.
Suppose the regulator imposes a uniform standard of 50
kg of emissions in each city. In the above diagram, identify the
areas representing the net social loss from under-control in the
urban area and the net social loss from over-control in the rural
area. Compute the dollar values of these areas.
MDu 10Eu 600 500...
Consider the following diagram. Suppose MDU represents marginal
damages in Toronto and MDR represents marginal damages in Thunder
Bay caused by emissions of carbon monoxide.
Suppose the regulator imposes a uniform standard of 50
kg of emissions in each city. In the above diagram, identify the
areas representing the net social loss from under-control in the
urban area and the net social loss from over-control in the rural
area. Compute the dollar values of these areas.
MDu 10Eu 600 500...
 Let E represent global emissions of CO2 from fossil fuel burning and cement Suppose that the marginal private surplus from emissions (the private surplus from each additional small unit of emissions) is described by the following function where E is the argument. (E 864-24*E The marginal external cost (the cost of an additional small unit of emissions) to the third parties is described by the following function. McEtemal(E) - 216 Units for MSrivae and MCEteal are S/t CO2 (where t...
 Let E represent global emissions of CO2 from fossil fuel burning and cement Suppose that the marginal private surplus from emissions (the private surplus from each additional small unit of emissions) is described by the following function where E is the argument. (E 864-24*E The marginal external cost (the cost of an additional small unit of emissions) to the third parties is described by the following function. McEtemal(E) - 216 Units for MSrivae and MCEteal are S/t CO2 (where t...
 Let E represent global emissions of CO2 from fossil fuel burning and cement Suppose that the marginal private surplus from emissions (the private surplus from each additional small unit of emissions) is described by the following function where E is the argument. (E 864-24*E The marginal external cost (the cost of an additional small unit of emissions) to the third parties is described by the following function. McEtemal(E) - 216 Units for MSrivae and MCEteal are S/t CO2 (where t...
 PRICE (Dollars per ton of paper) Consider the market for paper. Suppose that a paper factory dumps toxic waste into a nearby river, creating a negative externality for those living downstream from the factory. Producing an additional ton of paper imposes a constant external cost of $450 per ton. The following graph shows the demand (private value) curve and the supply (private cost) curve for paper. Use the purple points (diamond symbol) to plot the social cost curve when the...
 Part II: Market Failure in the Passenger Airline Industry and Policy (30%) For full marks: Craphs: Plot graphs to scale on graph paper by hand, include a figure number, title, and label all axis including correct units, be neat and tidy and put in order in the assignment. Introduce the graph with a sentence before it. 2) For algebra, use short sentences to guide the reader (SSTGR) through your work. Example: "To find the perfectly competitive market equilibrium global daily...
 Part II: Market Failure in the Passenger Airline Industry and Polis ) Farfalla Pleash paper and clude af a ti certi, bet tidy and put in ander in the mot h er 2) Forre the SSTGRE "To find the perfectly comparti l y o பழmal வான வடிவான மழைமை in tamil sis pl s. மன quantity back in the the M M C find they Check with other are a Theme a rcis Share of crude oil and the A dalid...
Most questions answered within 3 hours.
-
Explain in detail
Germany is the fifth largest economy
explain what goods and services Germany specializes...
asked 40 seconds ago -
The density of platinum is 21.45 g/mL. If a cube of platinum
with a mass of...
asked 5 minutes ago -
Accounts Receivable
Sales
A/R Posting
Extended Sales Invoice
Packing Slip
Compare invoice to packing slip 2...
asked 8 minutes ago -
Michaella, age 23, is a full-time law student and is claimed by
her parents as a...
asked 9 minutes ago -
Why are polymers not typically casted into products?
asked 26 minutes ago -
When rolling a die 129 times, what is the probability of rolling
a 6 no more...
asked 43 minutes ago -
4. A call option currently sells for $7.75. It has a strike
price of $85 and...
asked 31 minutes ago -
1.
You need to prepare 10.0 liters of an acid aqueous solution with a
pH of...
asked 34 minutes ago -
Along an aggregate supply curve, if the level of output is less
than the natural level...
asked 35 minutes ago -
By 2025, annual consumption in emerging markets will total $30
trillion and contribute more than ________...
asked 40 minutes ago -
At what point does reformation cease to be a viable option for
those who are oppressed...
asked 44 minutes ago -
Place letters corresponding to amounts in the proper order for
lightest to heaviest samples:
a) 2100...
asked 48 minutes ago