
Homework Answers
![istol, 242 +2.497) -(from tackle) =[(16.1–12-6) 4 (2-444 * 5 (85)2 + (49.412)] =[ 3.5+ 4.4839) = (-0.9839, 7.9839] -048, 7.98](http://img.homeworklib.com/questions/cadf9360-77ea-11ea-9126-b7909ec57051.png?x-oss-process=image/resize,w_560)
Add Answer to:
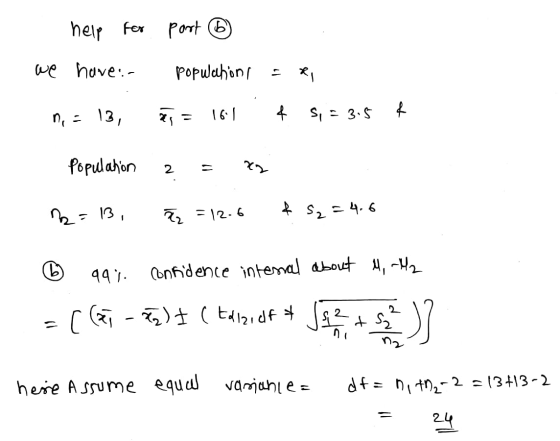
i beed help with part b. thanks!
Assume that both populations are normally distributed (a) Test...
Assume that both populations are normally distributed
 Assume that both populations are normally distributed(a) Test whether μ1 ≠ μ2 at the α=0.05 level of significance for the given sample data(b) Construct a 95 % confidence interval about μ1-μ2.(a) Test whether μ1 ≠ P2 at the α=0.05 level of significance for the given sample data. Determine the null and alternative hypothesis for this test.Determine the P-value for this hypothesis test.P=_______ (Round to threes decimal places as needed.)Should the null hypothesis be rejected?A. Reject H0, there is not sufficient...
Assume that both populations are normally distributed. (a) Test whether μ1≠μ2 at the α=0.01 level of...
Assume that both populations are normally distributed. (a) Test whether μ1≠μ2 at the α=0.01 level of significance for the given sample data. (b) Construct a 9999% confidence interval about 1−μ2. Population 1 Population 2 n 10 10 x overbarx 10.1 8.9 s 2.4 2.3 (a) Test whether μ1≠μ2 at the α=0.01 level of significance for the given sample data. Determine the null and alternative hypothesis for this test. Detemine the P-value for this hypothesis test. P=________. (Round to three decimal...
Sample 2 11 n X Assume that both populations are normally distributed a) Test whether ,...
 Sample 2 11 n X Assume that both populations are normally distributed a) Test whether , at the = 0.01 level of significance for the given sample data b) Construct a 50% confidence interval about 4-12 Sample 1 19 5078 21 11.9 Click the icon to view the Student distribution table a) Perform a hypothesis test. Determine the null and alternative hypotheses O A HOM > B. Hy: H2 OB HM, H, H2 + C Họ P = H1 H1...
Need help figuring out how the P value was obtained, can I please get a breakdown...
 Need help figuring out how the P value was obtained, can I
please get a breakdown of the process?
Population1 Population 2 Assume that both populations are normally distributed (a) Test whether ?1 12 at the ?:0.05 level of significance for the given sample data. (b) Construct a 95% confidence interval about 1- 16 5.6 (a) Test whether ?| 2 at the ? 0.05 level of significance for the given sample data. Determine the null and alternative hypothesis for this...
Need help figuring out how the P value was obtained, can I
please get a breakdown of the process?
Population1 Population 2 Assume that both populations are normally distributed (a) Test whether ?1 12 at the ?:0.05 level of significance for the given sample data. (b) Construct a 95% confidence interval about 1- 16 5.6 (a) Test whether ?| 2 at the ? 0.05 level of significance for the given sample data. Determine the null and alternative hypothesis for this...
Assume that both populations are normally distributed. a) Test whether H1 H2 at the a= 0.01...
 Assume that both populations are normally distributed. a) Test whether H1 H2 at the a= 0.01 level of significance for the given sample data. b) Construct a 99% confidence interval about 11 -42 n Sample 1 20 53.5 9.4 Sample 2 13 44.8 11.3 х s Click the icon to view the Student t-distribution table. a) Perform a hypothesis test. Determine the null and alternative hypotheses. A. HO HH2, H:17H2 O B. Ho H1 H2, H7:41 H2 OC. Ho H1...
Use the given statistics to complete parts (a) and (b). Assume that the populations are normally...
Use the given statistics to complete parts (a) and (b). Assume that the populations are normally distributed. Population 1 Population 2 n 26 16 x 49.8 40.1 s 6.8 13.2 (a) Test whether μ1 > μ2 at the α = 0.01 level of significance for the given sample data. (b) Construct a 90% confidence interval about μ1 − μ2 . (a) Identify the null and alternative hypotheses for this test. A. H0 : μ1 ≠...
Two samples each of size 20 are taken from independent populations assumed to be normally distributed...
 Two samples each of size 20 are taken from independent populations assumed to be normally distributed with equal variances. The first sample has a mean of 43.5 and a standard deviation of 4.1 while the second sample has a mean of 40.1 and a standard deviation of 3.2. A researcher would like to test if there is a difference between the population means at the 0.05 significance level. What can the researcher conclude? There is not sufficient evidence to reject...
Independent random samples were selected from each of two normally distributed populations, n = 6 from...
 Independent random samples were selected from each of two normally distributed populations, n = 6 from population 1 and n2 = 5 from population 2. The data are shown in the table to the right. Complete parts a through c below. 4.7 4.6 1.6 2.3 1.2 3.8 0.6 3.9 C. Test Ho: 02202 against He:0; >o. Use a = 0.01. Determine the test statistic. F= (Round to two decimal places as needed.) Find the p-value. p= (Round to three decimal...
would really appriciate help! thank you! Use the given statistics to complete parts (a) and (b)....
 would really appriciate help! thank you!
Use the given statistics to complete parts (a) and (b). Assume that the populations are normally distributed. (a) Test whether Hy Hy at the a=0.05 level of significance for the given sample data. (b) Construct a 99% confidence interval about 14 - My Population 1 Population 2 15 mm 51.9 S (a) Identity the noll and alternative hypotheses for this test On Hy hh OBH, H, OEM ос. н. " HA OF H2 OD....
would really appriciate help! thank you!
Use the given statistics to complete parts (a) and (b). Assume that the populations are normally distributed. (a) Test whether Hy Hy at the a=0.05 level of significance for the given sample data. (b) Construct a 99% confidence interval about 14 - My Population 1 Population 2 15 mm 51.9 S (a) Identity the noll and alternative hypotheses for this test On Hy hh OBH, H, OEM ос. н. " HA OF H2 OD....
In order to compare the means of two populations, independent random samples of 400 observations are...
In order to compare the means of two populations, independent random samples of 400 observations are selected from each population, with the results found in the table to the right. Complete parts a through e below. Sample 1 overbar x = 5,305 s1= 154 Sample 2 overbar x = 5,266 s2 = 199 a. Use a 95% confidence interval to estimate the difference between the population means (mu 1 - mu 2). Interpret the confidence interval. The confidence interval is...
 Assume that both populations are normally distributed(a) Test whether μ1 ≠ μ2 at the α=0.05 level of significance for the given sample data(b) Construct a 95 % confidence interval about μ1-μ2.(a) Test whether μ1 ≠ P2 at the α=0.05 level of significance for the given sample data. Determine the null and alternative hypothesis for this test.Determine the P-value for this hypothesis test.P=_______ (Round to threes decimal places as needed.)Should the null hypothesis be rejected?A. Reject H0, there is not sufficient...
 Sample 2 11 n X Assume that both populations are normally distributed a) Test whether , at the = 0.01 level of significance for the given sample data b) Construct a 50% confidence interval about 4-12 Sample 1 19 5078 21 11.9 Click the icon to view the Student distribution table a) Perform a hypothesis test. Determine the null and alternative hypotheses O A HOM > B. Hy: H2 OB HM, H, H2 + C Họ P = H1 H1...
 Need help figuring out how the P value was obtained, can I
please get a breakdown of the process?
Population1 Population 2 Assume that both populations are normally distributed (a) Test whether ?1 12 at the ?:0.05 level of significance for the given sample data. (b) Construct a 95% confidence interval about 1- 16 5.6 (a) Test whether ?| 2 at the ? 0.05 level of significance for the given sample data. Determine the null and alternative hypothesis for this...
Need help figuring out how the P value was obtained, can I
please get a breakdown of the process?
Population1 Population 2 Assume that both populations are normally distributed (a) Test whether ?1 12 at the ?:0.05 level of significance for the given sample data. (b) Construct a 95% confidence interval about 1- 16 5.6 (a) Test whether ?| 2 at the ? 0.05 level of significance for the given sample data. Determine the null and alternative hypothesis for this...
 Assume that both populations are normally distributed. a) Test whether H1 H2 at the a= 0.01 level of significance for the given sample data. b) Construct a 99% confidence interval about 11 -42 n Sample 1 20 53.5 9.4 Sample 2 13 44.8 11.3 х s Click the icon to view the Student t-distribution table. a) Perform a hypothesis test. Determine the null and alternative hypotheses. A. HO HH2, H:17H2 O B. Ho H1 H2, H7:41 H2 OC. Ho H1...
 Two samples each of size 20 are taken from independent populations assumed to be normally distributed with equal variances. The first sample has a mean of 43.5 and a standard deviation of 4.1 while the second sample has a mean of 40.1 and a standard deviation of 3.2. A researcher would like to test if there is a difference between the population means at the 0.05 significance level. What can the researcher conclude? There is not sufficient evidence to reject...
 Independent random samples were selected from each of two normally distributed populations, n = 6 from population 1 and n2 = 5 from population 2. The data are shown in the table to the right. Complete parts a through c below. 4.7 4.6 1.6 2.3 1.2 3.8 0.6 3.9 C. Test Ho: 02202 against He:0; >o. Use a = 0.01. Determine the test statistic. F= (Round to two decimal places as needed.) Find the p-value. p= (Round to three decimal...
 would really appriciate help! thank you!
Use the given statistics to complete parts (a) and (b). Assume that the populations are normally distributed. (a) Test whether Hy Hy at the a=0.05 level of significance for the given sample data. (b) Construct a 99% confidence interval about 14 - My Population 1 Population 2 15 mm 51.9 S (a) Identity the noll and alternative hypotheses for this test On Hy hh OBH, H, OEM ос. н. " HA OF H2 OD....
would really appriciate help! thank you!
Use the given statistics to complete parts (a) and (b). Assume that the populations are normally distributed. (a) Test whether Hy Hy at the a=0.05 level of significance for the given sample data. (b) Construct a 99% confidence interval about 14 - My Population 1 Population 2 15 mm 51.9 S (a) Identity the noll and alternative hypotheses for this test On Hy hh OBH, H, OEM ос. н. " HA OF H2 OD....
Most questions answered within 3 hours.
-
Please Help ASAP.
1Consider the below code which iterates over a linked
list of n nodes...
asked 4 minutes ago -
Determine the air to fuel ratio of:
Canadian natural gas, with 93.9% methane, 4.2% ethane, 0.3%...
asked 5 minutes ago -
A manufacturer of power tools claims that the average amount of
time required to assemble their...
asked 7 minutes ago -
"electron-withdrawing substituents on carbon encourage back
donation", then on the next page he says that "greater...
asked 18 minutes ago -
On December 31, 2016, the shareholders’ equity section of the
balance sheet of R & L...
asked 27 minutes ago -
16.7
At t=0s a small "upward" (positive y) pulse centered at x = 5.0
m is...
asked 40 minutes ago -
Twitter Users and News: A poll conducted in 2013 found that 52%
of U.S. adult Twitter...
asked 55 minutes ago -
How
would I know whether a given amino acid has an ionizable group or
not? please...
asked 1 hour ago -
True or false?
True False The function of the enzyme acyl CoA
synthetase is the ATP-dependent coupling...
asked 1 hour ago -
Nadia Corporation adjusts its debt so that its interest coverage
(EBIT/Interest) remains constant at 3. Nadia’s...
asked 1 hour ago -
In a clinical trial, 20 out of 600 patients taking a
prescription drug complained of flulike...
asked 1 hour ago -
7. How many types of nuclear processes can produce energy? 8.
How many types of radioactive...
asked 1 hour ago