
Homework Answers
The statistic software output for this problem is:
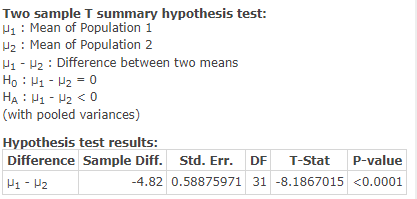
(a) t = -8.187
(b) The range of p-value is :
P-value < 0.01
The conclusion is :

Add Answer to:
Consider the following summary statistics, calculated from two independent random samples taken from normally distributed populations....
Consider the following summary statistics, calculated from two independent random samples taken from normally distributed populations....
Consider the following summary statistics, calculated from two independent random samples taken from normally distributed populations. Sample 1 Sample 2 x¯1=20.92 x¯2=26.80 s21=2.89 s22=3.81 n1=19 n2=15 Test the null hypothesis H0:μ1=μ2against the alternative hypothesis HA:μ1<μ2. a) Calculate the test statistic for the Welch Approximate t procedure. Round your response to at least 3 decimal places. b) The Welch-Satterthwaite approximation to the degrees of freedom is given by df = 27.983055. Using this information, determine the range in which the p-value...
Consider the following summary statistics, calculated from two independent random samples taken from normally distributed populations....
Consider the following summary statistics, calculated from two independent random samples taken from normally distributed populations. Sample 1 Sample 2 x¯1=20.08 x¯2=24.51 s21=2.05 s22=3.20 n1=19 n2=16 Test the null hypothesis H0:μ1=μ2against the alternative hypothesis HA:μ1<μ2. a) Calculate the test statistic for the Welch Approximate t procedure. Round your response to at least 3 decimal places. b) The Welch-Satterthwaite approximation to the degrees of freedom is given by df = 28.610808. Using this information, determine the range in which the p-value...
Consider the following summary statistics, calculated from two independent random samples taken from normally distributed populations....
 Consider the following summary statistics, calculated from two independent random samples taken from normally distributed populations. Sample 1 F1 = 23.65 = 2.50 p1 = 18 Sample 2 F2 = 25.62 = 3.28 p2 = 20 Test the null hypothesis Ho: P1 = r2 against the alternative hypothesis HA : H1 CH2 a) Calculate the test statistic for the Welch Approximate procedure. Round your response to at least 3 decimal places. Number b) The Welch-Satterthwaite approximation to the degrees of...
Consider the following summary statistics that were calculated on the difference between two dependent random samples,...
 Consider the following summary statistics that were calculated on the difference between two dependent random samples, obtained from two normally distributecd populations Summary Statistic D 0.342 D0.0834 Test the null hypothesis Ho: HD 0 against the altemative hypothesis HA: HD>0 a) Calculate the value of the ttest statistic. Round your response to at least 3 decimal places. Number b) What is the range in which the p-value falls? O p-value >0.10 O 0.05<p-value 0.10 0.025<p-value <0.05 O 0.010 <p-value<0.025 O...
If we wish to carry out inference procedures on the mean of a normally distributed population...
 If we wish to carry out inference procedures on the mean of a normally distributed population where sigma is known, we a) Click for List - should use the distribution. b) Click for List Both the t distribution and the standard normal distribution have a median of O. c) Click for List For the t distribution, the mean and variance are always equal. d) Click for List The t distribution has more area in the tails than the standard normal...
1) Consider two independent random samples of sizes n1 = 14 and n2 = 14, taken...
1) Consider two independent random samples of sizes n1 = 14 and n2 = 14, taken from two normally distributed populations. The sample standard deviations are calculated to be s1= 1.98 and s2 = 5.71, and the sample means are x¯1=-10.2and x¯2=-2.34, respectively. Using this information, test the null hypothesis H0:μ1=μ2against the one-sided alternative HA:μ1<μ2, using Welch's 2-sample t Procedure for independent samples. a) Calculate the value for the t test statistic. Round your response to at least 2 decimal...
Two samples each of size 20 are taken from independent populations assumed to be normally distributed...
 Two samples each of size 20 are taken from independent populations assumed to be normally distributed with equal variances. The first sample has a mean of 43.5 and a standard deviation of 4.1 while the second sample has a mean of 40.1 and a standard deviation of 3.2. A researcher would like to test if there is a difference between the population means at the 0.05 significance level. What can the researcher conclude? There is not sufficient evidence to reject...
Given two independent random samples with the following results: n1= 658 n2 = 550 x1=362 ...
Given two independent random samples with the following results: n1= 658 n2 = 550 x1=362 x2=194 Can it be concluded that there is a difference between the two population proportions? Use a significance level of α=0.01 for the test. Step 1 of 5: State the null and alternative hypotheses for the test. Step 2 of 5: Find the values of the two sample proportions, pˆ1 and pˆ2. Round your answers to three decimal places. Step 3 of 5: Compute...
Summary statistics are given for independent simple random samples from two populations. Use the pooled t-tes...
 Summary statistics are given for independent simple random samples from two populations. Use the pooled t-tes conduct the required hypothesis test. 8) x1 = 13, 51 =5, n1 = 10, x2 = 21, 52 = 4, n2 = 14 Perform a left-tailed hypothesis test using a significance level of a = 0.05. A) Test statistic t = -1.526526 B) Test statistic t -4.355 Critical value-1.717 Critical value=-2.074 0.05 <P<0.10 P<0.005 Do not reject Ho Reject Ho C) Test statistic t...
Assume that both populations are normally distributed
 Assume that both populations are normally distributed(a) Test whether μ1 ≠ μ2 at the α=0.05 level of significance for the given sample data(b) Construct a 95 % confidence interval about μ1-μ2.(a) Test whether μ1 ≠ P2 at the α=0.05 level of significance for the given sample data. Determine the null and alternative hypothesis for this test.Determine the P-value for this hypothesis test.P=_______ (Round to threes decimal places as needed.)Should the null hypothesis be rejected?A. Reject H0, there is not sufficient...
 Consider the following summary statistics, calculated from two independent random samples taken from normally distributed populations. Sample 1 F1 = 23.65 = 2.50 p1 = 18 Sample 2 F2 = 25.62 = 3.28 p2 = 20 Test the null hypothesis Ho: P1 = r2 against the alternative hypothesis HA : H1 CH2 a) Calculate the test statistic for the Welch Approximate procedure. Round your response to at least 3 decimal places. Number b) The Welch-Satterthwaite approximation to the degrees of...
 Consider the following summary statistics that were calculated on the difference between two dependent random samples, obtained from two normally distributecd populations Summary Statistic D 0.342 D0.0834 Test the null hypothesis Ho: HD 0 against the altemative hypothesis HA: HD>0 a) Calculate the value of the ttest statistic. Round your response to at least 3 decimal places. Number b) What is the range in which the p-value falls? O p-value >0.10 O 0.05<p-value 0.10 0.025<p-value <0.05 O 0.010 <p-value<0.025 O...
 If we wish to carry out inference procedures on the mean of a normally distributed population where sigma is known, we a) Click for List - should use the distribution. b) Click for List Both the t distribution and the standard normal distribution have a median of O. c) Click for List For the t distribution, the mean and variance are always equal. d) Click for List The t distribution has more area in the tails than the standard normal...
 Two samples each of size 20 are taken from independent populations assumed to be normally distributed with equal variances. The first sample has a mean of 43.5 and a standard deviation of 4.1 while the second sample has a mean of 40.1 and a standard deviation of 3.2. A researcher would like to test if there is a difference between the population means at the 0.05 significance level. What can the researcher conclude? There is not sufficient evidence to reject...
 Summary statistics are given for independent simple random samples from two populations. Use the pooled t-tes conduct the required hypothesis test. 8) x1 = 13, 51 =5, n1 = 10, x2 = 21, 52 = 4, n2 = 14 Perform a left-tailed hypothesis test using a significance level of a = 0.05. A) Test statistic t = -1.526526 B) Test statistic t -4.355 Critical value-1.717 Critical value=-2.074 0.05 <P<0.10 P<0.005 Do not reject Ho Reject Ho C) Test statistic t...
 Assume that both populations are normally distributed(a) Test whether μ1 ≠ μ2 at the α=0.05 level of significance for the given sample data(b) Construct a 95 % confidence interval about μ1-μ2.(a) Test whether μ1 ≠ P2 at the α=0.05 level of significance for the given sample data. Determine the null and alternative hypothesis for this test.Determine the P-value for this hypothesis test.P=_______ (Round to threes decimal places as needed.)Should the null hypothesis be rejected?A. Reject H0, there is not sufficient...
Most questions answered within 3 hours.
-
Why did the observed chemistry of thallium mislead Mendelev to
place the group 13 element (Tl)...
asked 1 hour ago -
A sine wave signal is displayed on the screen of an
oscilloscope. 6 peak-to-peak divisions are...
asked 3 hours ago -
a
1500 kg car accelerates from 0 to 25 m / s in 21.0s. How much...
asked 4 hours ago -
Calculate the molarity of each of the following solutions:
(a) 30.5 g of ethanol (C2H5OH) in...
asked 4 hours ago -
1 Refer to the build-borrow-or-buy framework as a decision tree
for the Adidas company. Identify a...
asked 5 hours ago -
Problem 2: The Problem of Social Cost. A Rancher and Farmer live
side-by-side to each other....
asked 6 hours ago -
a uniform bar of weight 40N is 4 meter long. weights
on 60N and 100N are...
asked 5 hours ago -
Define Diet counceling? What are the
responsibilities of a counselor?
asked 7 hours ago -
Hey im just confused about how to put the ' A angle n' and ' S...
asked 7 hours ago -
A short essay about the WSJ article on Oreo versus Hydrox.
asked 8 hours ago -
##8. A program contains the following function definition:
##def cube(num):
##return num * num * num...
asked 8 hours ago -
find the value z of a standard Normal variable that satisfies
each of the given conditions....
asked 8 hours ago