


3. Using information in Note 8, compare the amount recorded for Wendy’s investment in TimWen at December 30, 2012 with Wendy’s 50% share of TimeWen’s equity at December 30, 2012. What accounts for the difference between these two amounts? Show calculations to reconcile the two figures.
4. Consider the information disclosed in Note 8 regarding Wendy’s investment in the TimWen Joint Venture.
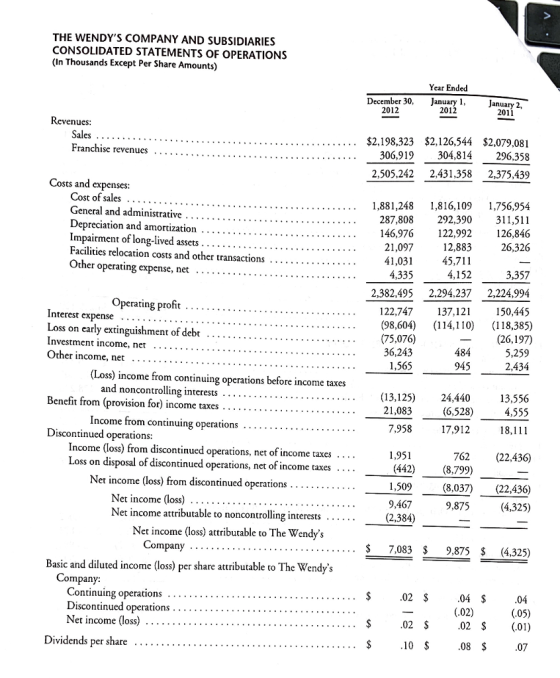
a. How did Wendy’s equity method investment in TimWen affect their earnings before taxes in 2012 and 2011? Where does this appear in Wendy’s consolidated statements of operations?
b. Prepare the journal entry to record Wendy’s share of TimWen’s 2012 earnings.
c. What is the amount of amortization of the purchase price adjustments in 2012? Prepare the journal entry to record the amortization for the purchase price adjustments for 2012.
d. What amount of dividends did Wendy's receive from the TimWen joint venture in 2012 and 2011? Prepare the journal entry to record the receipt of dividends from TimWen for 2012.
5. Consider the information in the statement of cash flows.

a. The operating activities section of the statement of cash flows reports a negative adjustment for “Equity in earnings in joint ventures, net” of $8,724 in 2012. Reconcile this amount to the information disclosed in Note 8. Explain why a negative adjustment is made to arrive at net cash from operating activities.
b. The operating section also reports a positive adjustment for “Distributions received from joint venture” of $15,274 in 2012. Reconcile this amount to the information disclosed in Note 8. Explain why a positive adjustment is made to arrive at net cash from operating activities.
Homework Answers
As per the HOMEWORKLIB POLICY, first four questions will be answered.
Answer:3
Wendy’s investment in TimWen at December 31, 2012 = $89,370
Wendy’s share of TimWen equity on December 31, 2012 = $35,282 (89370-54088) and it is 50% of partners’ equity.
Difference = $54,088.
This states that Wendy’s investment exceeded interest in underlying equity because of purchase price adjustments from the merger.
Part-4A)
In equity method of investment, Earnings are adjusted to amortization of acquisition price.
In 2012, earnings before taxes = $10,551 ($13,680 - $3,129 amortization).
In 2011, earnings before taxes = $10,571 ($13,505 - $2,934).
Wendy reports it in the consolidated statements of operations under the heading “other operating expenses”.
Part-4B)
|
Account titles and explanation |
Debit |
Credit |
|
Investment in joint venture |
13,680 |
|
|
Investment income |
13,680 |
Part-4C)
Amortization amount = $3129
|
Account titles and explanation |
Debit |
Credit |
|
Loss in Investment |
3129 |
|
|
Investment in joint venture |
3129 |
Part -4D)
Amount of dividend = $15274
|
Account titles and explanation |
Debit |
Credit |
|
Cash |
15274 |
|
|
Investment in joint venture |
15274 |
Part-5A)
Reason for negative statement:
When the earnings were discovered, they were included in net income. Now in case of non-cash transaction, the amounts should be subtracted from the net income value (while preparing cash flow statement). So, this can be counted as:
Earnings before taxes of $10,551 – $1,827.
Part-5B)
Reason for positive statement: Dividends from cash
Initially, this income was not included in statement. The reason behind that was the income of the owner was not counted for the statement. This amount should be same as “Distribution received” (Note-8).
Add Answer to:
3. Using information in Note 8, compare the amount recorded for
Wendy’s investment in TimWen at...
3. Using the attached excerpts from Coca Cola's 2018 Annual Report (financial statements and Note 8:...
 3. Using the attached excerpts from Coca Cola's 2018 Annual Report (financial statements and Note 8: Property, Plant, and Equipment) answer the following questions. In addition: - All numbers are in Smillions (except per share data). - Provide calculations when necessary. a. Long-term Assets i) ii) iii) What is the total value of Coca Cola's long-term assets as of December 31, 2018? What is the net book value (NBV) of Coca Cola's property, plant and equipment as of December 31,...
Based on the information contained in these financial statements, compute free cash flow for Amazon at...
 Based on the information contained in these financial
statements, compute free cash flow for Amazon at December 31, 2016
and Wal-Mart for January 31, 2017. What conclusions concerning the
management of cash can be drawn from free cash flow for each
company?
AMAZON.COM, INC. CONSOLIDATED STATEMENTS OF CASH FLOWS in millions) Year Ended December 31, 2014 2015 2016 $ 8,658 $ 14.557 $ 15,890 (241) 596 2,371 4.746 1,497 129 6,281 2,119 155 250 8,116 2,975 160 (20) (246) (829)...
Based on the information contained in these financial
statements, compute free cash flow for Amazon at December 31, 2016
and Wal-Mart for January 31, 2017. What conclusions concerning the
management of cash can be drawn from free cash flow for each
company?
AMAZON.COM, INC. CONSOLIDATED STATEMENTS OF CASH FLOWS in millions) Year Ended December 31, 2014 2015 2016 $ 8,658 $ 14.557 $ 15,890 (241) 596 2,371 4.746 1,497 129 6,281 2,119 155 250 8,116 2,975 160 (20) (246) (829)...
Comparative Analysis Case The Coca-Cola Company and PepsiCo, Inc. The financial statements of Coca-Cola and PepsiCo...
 Comparative Analysis Case The Coca-Cola Company and PepsiCo, Inc. The financial statements of Coca-Cola and PepsiCo are presented in Appendices C and D, respectively. The companies' complete annual reports, including the notes to the financial statements, are available online. Instructions Use the companies' financial information to answer the following questions. a. What kind of pension plans do Coca-Cola and PepsiCo provide their employees? b. What net periodic pension expense (cost) did Coca-Cola and PepsiCo report in 2017? c. What is...
eTextbook and Media Based on the information in these financial statements, compute the 2014 return on...
 eTextbook and Media
Based on the information in these financial statements, compute
the 2014 return on common stockholders’ equity, debt to assets
ratio, and return on assets for each company. (Round
answers to 1 decimal places, e.g. 15.2%.)
Columbia Sportswear
Company
VF
Corporation
Return on common stockholders’ equity
%
%
Debt to assets
%
%
Return on assets
%
%
Compute the payout ratio for each company. (Round
answers to 1 decimal places, e.g. 15.2%.)
Columbia Sportswear Company
VF Corporation...
eTextbook and Media
Based on the information in these financial statements, compute
the 2014 return on common stockholders’ equity, debt to assets
ratio, and return on assets for each company. (Round
answers to 1 decimal places, e.g. 15.2%.)
Columbia Sportswear
Company
VF
Corporation
Return on common stockholders’ equity
%
%
Debt to assets
%
%
Return on assets
%
%
Compute the payout ratio for each company. (Round
answers to 1 decimal places, e.g. 15.2%.)
Columbia Sportswear Company
VF Corporation...
Describe/ Explain the financial numbers in the attached Coca Cola report such as EPS, EBIT,assets, liabilities,...
 Describe/ Explain the financial numbers in the attached Coca Cola
report such as EPS, EBIT,assets, liabilities, and other financial
numbers. (For example explain if the company is doing good or bad
based on the number from previous year 2016-2015). explain how the
financial numbers are used in the strategic planning process as
related to the products sold and markets the sell into?
THE COCA-COLA COMPANY AND SUBSIDIARIES CONSOLIDATED STATEMENTS OF INCOME 2016 2015 2014 (In millions except per share data)...
Describe/ Explain the financial numbers in the attached Coca Cola
report such as EPS, EBIT,assets, liabilities, and other financial
numbers. (For example explain if the company is doing good or bad
based on the number from previous year 2016-2015). explain how the
financial numbers are used in the strategic planning process as
related to the products sold and markets the sell into?
THE COCA-COLA COMPANY AND SUBSIDIARIES CONSOLIDATED STATEMENTS OF INCOME 2016 2015 2014 (In millions except per share data)...
Amazon.com, Inc.’s financial statements are presented in Appendix D. . Financial statements of Wal-Mart Stores, Inc....
 Amazon.com, Inc.’s financial statements are
presented in Appendix D.
.
Financial statements of Wal-Mart Stores, Inc. are
presented in Appendix E.
(b) What conclusions concerning the management of
cash can be drawn from free cash flow for each company?
AMAZON.COM, INC. CONSOLIDATED STATEMENTS OF CASH FLOWS (in millions) Year Ended December 31, 2014 2015 8,658 $ 14,557 $ 2016 15,890 (241) 596 2,371 4,746 1,497 129 6.281 2,119 155 250 81 (119) 59 8,116 2.975 160 (20) (246) (829) (316)...
Amazon.com, Inc.’s financial statements are
presented in Appendix D.
.
Financial statements of Wal-Mart Stores, Inc. are
presented in Appendix E.
(b) What conclusions concerning the management of
cash can be drawn from free cash flow for each company?
AMAZON.COM, INC. CONSOLIDATED STATEMENTS OF CASH FLOWS (in millions) Year Ended December 31, 2014 2015 8,658 $ 14,557 $ 2016 15,890 (241) 596 2,371 4,746 1,497 129 6.281 2,119 155 250 81 (119) 59 8,116 2.975 160 (20) (246) (829) (316)...
Walmart has 11,000 million shares authorized What percentage of authorized shares was issued by Amazon at...
 Walmart has 11,000 million shares authorized What percentage of authorized shares was issued by Amazon at December 31, 2015, and by Wal-Mart at January 31, 2016? (Round answers to 1 decimal place, e.g. 52.5%.) Amazon Wal-Mart Percentage of authorized shares issued % % How many shares are held as treasury stock by Amazon at December 31, 2015, and by Wal-Mart at January 31, 2016? (Enter answers in millions. If answer is zero, please enter for the amount. Do not leave...
Comparative Analysis Casemobivio de The Coca-Cola Company and PepsiCo, Inc. The financial statements of Coca-Cola and...
 Comparative Analysis Casemobivio de The Coca-Cola Company and PepsiCo, Inc. The financial statements of Coca-Cola and PepsiCo are presented in Appendices C and D, respectively. The companies' complete annual reports, including the notes to the financial statements, are available online. Stock price data can be found in the company's annual 10K, filed at the SEC. Instructions Use the companies' financial information to answer the following questions. a. What is the par or stated value of Coca-Cola's and PepsiCo's common or...
Refer to the financial statements of The Home Depot in Appendix A. (Note: Fiscal 2016 for...
 Refer to the financial statements of The Home Depot in Appendix
A. (Note: Fiscal 2016 for The Home Depot runs from February 1,
2016, to January 29, 2017. As with many retail companies, The Home
Depot labels the period “Fiscal 2016” even though it ends in the
2017 calendar year. The label “Fiscal 2016” is appropriate because
Fiscal 2016 includes 11 months from the 2016 calendar year. The
Home Depot explains its choice of fiscal period in Note 1 to...
Refer to the financial statements of The Home Depot in Appendix
A. (Note: Fiscal 2016 for The Home Depot runs from February 1,
2016, to January 29, 2017. As with many retail companies, The Home
Depot labels the period “Fiscal 2016” even though it ends in the
2017 calendar year. The label “Fiscal 2016” is appropriate because
Fiscal 2016 includes 11 months from the 2016 calendar year. The
Home Depot explains its choice of fiscal period in Note 1 to...
Please help, i am desperate, i cant figure it out. Expand Your Critical Thinking 12-03 a...
 Please help, i am desperate, i cant figure it out.
Expand Your Critical Thinking 12-03 a Amazon.com, Inc.'s financial statements are presented in Appendix D. Click here to view Appendix D. Financial statements of Wal-Mart Stores, Inc. are presented in Appendix E. Click here to view Appendix E. (a) Based on the information contained in these financial statements, compute free cash fl (15, 000). Enter amounts in millions.) Amazon.com, Inc. Wal-Mart Stores, Inc. Free cash flow Click if you would...
Please help, i am desperate, i cant figure it out.
Expand Your Critical Thinking 12-03 a Amazon.com, Inc.'s financial statements are presented in Appendix D. Click here to view Appendix D. Financial statements of Wal-Mart Stores, Inc. are presented in Appendix E. Click here to view Appendix E. (a) Based on the information contained in these financial statements, compute free cash fl (15, 000). Enter amounts in millions.) Amazon.com, Inc. Wal-Mart Stores, Inc. Free cash flow Click if you would...
 3. Using the attached excerpts from Coca Cola's 2018 Annual Report (financial statements and Note 8: Property, Plant, and Equipment) answer the following questions. In addition: - All numbers are in Smillions (except per share data). - Provide calculations when necessary. a. Long-term Assets i) ii) iii) What is the total value of Coca Cola's long-term assets as of December 31, 2018? What is the net book value (NBV) of Coca Cola's property, plant and equipment as of December 31,...
 Based on the information contained in these financial
statements, compute free cash flow for Amazon at December 31, 2016
and Wal-Mart for January 31, 2017. What conclusions concerning the
management of cash can be drawn from free cash flow for each
company?
AMAZON.COM, INC. CONSOLIDATED STATEMENTS OF CASH FLOWS in millions) Year Ended December 31, 2014 2015 2016 $ 8,658 $ 14.557 $ 15,890 (241) 596 2,371 4.746 1,497 129 6,281 2,119 155 250 8,116 2,975 160 (20) (246) (829)...
Based on the information contained in these financial
statements, compute free cash flow for Amazon at December 31, 2016
and Wal-Mart for January 31, 2017. What conclusions concerning the
management of cash can be drawn from free cash flow for each
company?
AMAZON.COM, INC. CONSOLIDATED STATEMENTS OF CASH FLOWS in millions) Year Ended December 31, 2014 2015 2016 $ 8,658 $ 14.557 $ 15,890 (241) 596 2,371 4.746 1,497 129 6,281 2,119 155 250 8,116 2,975 160 (20) (246) (829)...
 Comparative Analysis Case The Coca-Cola Company and PepsiCo, Inc. The financial statements of Coca-Cola and PepsiCo are presented in Appendices C and D, respectively. The companies' complete annual reports, including the notes to the financial statements, are available online. Instructions Use the companies' financial information to answer the following questions. a. What kind of pension plans do Coca-Cola and PepsiCo provide their employees? b. What net periodic pension expense (cost) did Coca-Cola and PepsiCo report in 2017? c. What is...
 eTextbook and Media
Based on the information in these financial statements, compute
the 2014 return on common stockholders’ equity, debt to assets
ratio, and return on assets for each company. (Round
answers to 1 decimal places, e.g. 15.2%.)
Columbia Sportswear
Company
VF
Corporation
Return on common stockholders’ equity
%
%
Debt to assets
%
%
Return on assets
%
%
Compute the payout ratio for each company. (Round
answers to 1 decimal places, e.g. 15.2%.)
Columbia Sportswear Company
VF Corporation...
eTextbook and Media
Based on the information in these financial statements, compute
the 2014 return on common stockholders’ equity, debt to assets
ratio, and return on assets for each company. (Round
answers to 1 decimal places, e.g. 15.2%.)
Columbia Sportswear
Company
VF
Corporation
Return on common stockholders’ equity
%
%
Debt to assets
%
%
Return on assets
%
%
Compute the payout ratio for each company. (Round
answers to 1 decimal places, e.g. 15.2%.)
Columbia Sportswear Company
VF Corporation...
 Describe/ Explain the financial numbers in the attached Coca Cola
report such as EPS, EBIT,assets, liabilities, and other financial
numbers. (For example explain if the company is doing good or bad
based on the number from previous year 2016-2015). explain how the
financial numbers are used in the strategic planning process as
related to the products sold and markets the sell into?
THE COCA-COLA COMPANY AND SUBSIDIARIES CONSOLIDATED STATEMENTS OF INCOME 2016 2015 2014 (In millions except per share data)...
Describe/ Explain the financial numbers in the attached Coca Cola
report such as EPS, EBIT,assets, liabilities, and other financial
numbers. (For example explain if the company is doing good or bad
based on the number from previous year 2016-2015). explain how the
financial numbers are used in the strategic planning process as
related to the products sold and markets the sell into?
THE COCA-COLA COMPANY AND SUBSIDIARIES CONSOLIDATED STATEMENTS OF INCOME 2016 2015 2014 (In millions except per share data)...
 Amazon.com, Inc.’s financial statements are
presented in Appendix D.
.
Financial statements of Wal-Mart Stores, Inc. are
presented in Appendix E.
(b) What conclusions concerning the management of
cash can be drawn from free cash flow for each company?
AMAZON.COM, INC. CONSOLIDATED STATEMENTS OF CASH FLOWS (in millions) Year Ended December 31, 2014 2015 8,658 $ 14,557 $ 2016 15,890 (241) 596 2,371 4,746 1,497 129 6.281 2,119 155 250 81 (119) 59 8,116 2.975 160 (20) (246) (829) (316)...
Amazon.com, Inc.’s financial statements are
presented in Appendix D.
.
Financial statements of Wal-Mart Stores, Inc. are
presented in Appendix E.
(b) What conclusions concerning the management of
cash can be drawn from free cash flow for each company?
AMAZON.COM, INC. CONSOLIDATED STATEMENTS OF CASH FLOWS (in millions) Year Ended December 31, 2014 2015 8,658 $ 14,557 $ 2016 15,890 (241) 596 2,371 4,746 1,497 129 6.281 2,119 155 250 81 (119) 59 8,116 2.975 160 (20) (246) (829) (316)...
 Walmart has 11,000 million shares authorized What percentage of authorized shares was issued by Amazon at December 31, 2015, and by Wal-Mart at January 31, 2016? (Round answers to 1 decimal place, e.g. 52.5%.) Amazon Wal-Mart Percentage of authorized shares issued % % How many shares are held as treasury stock by Amazon at December 31, 2015, and by Wal-Mart at January 31, 2016? (Enter answers in millions. If answer is zero, please enter for the amount. Do not leave...
 Comparative Analysis Casemobivio de The Coca-Cola Company and PepsiCo, Inc. The financial statements of Coca-Cola and PepsiCo are presented in Appendices C and D, respectively. The companies' complete annual reports, including the notes to the financial statements, are available online. Stock price data can be found in the company's annual 10K, filed at the SEC. Instructions Use the companies' financial information to answer the following questions. a. What is the par or stated value of Coca-Cola's and PepsiCo's common or...
 Refer to the financial statements of The Home Depot in Appendix
A. (Note: Fiscal 2016 for The Home Depot runs from February 1,
2016, to January 29, 2017. As with many retail companies, The Home
Depot labels the period “Fiscal 2016” even though it ends in the
2017 calendar year. The label “Fiscal 2016” is appropriate because
Fiscal 2016 includes 11 months from the 2016 calendar year. The
Home Depot explains its choice of fiscal period in Note 1 to...
Refer to the financial statements of The Home Depot in Appendix
A. (Note: Fiscal 2016 for The Home Depot runs from February 1,
2016, to January 29, 2017. As with many retail companies, The Home
Depot labels the period “Fiscal 2016” even though it ends in the
2017 calendar year. The label “Fiscal 2016” is appropriate because
Fiscal 2016 includes 11 months from the 2016 calendar year. The
Home Depot explains its choice of fiscal period in Note 1 to...
 Please help, i am desperate, i cant figure it out.
Expand Your Critical Thinking 12-03 a Amazon.com, Inc.'s financial statements are presented in Appendix D. Click here to view Appendix D. Financial statements of Wal-Mart Stores, Inc. are presented in Appendix E. Click here to view Appendix E. (a) Based on the information contained in these financial statements, compute free cash fl (15, 000). Enter amounts in millions.) Amazon.com, Inc. Wal-Mart Stores, Inc. Free cash flow Click if you would...
Please help, i am desperate, i cant figure it out.
Expand Your Critical Thinking 12-03 a Amazon.com, Inc.'s financial statements are presented in Appendix D. Click here to view Appendix D. Financial statements of Wal-Mart Stores, Inc. are presented in Appendix E. Click here to view Appendix E. (a) Based on the information contained in these financial statements, compute free cash fl (15, 000). Enter amounts in millions.) Amazon.com, Inc. Wal-Mart Stores, Inc. Free cash flow Click if you would...
Most questions answered within 3 hours.
-
Write a program to solve the Josephus problem, with the following
modification:
Sample Input:
./a.out n...
asked 1 minute ago -
At the start of a CD it is spinning at a rate of 525 rpm
(revolutions...
asked 37 minutes ago -
4. Without doing any calculations, predict whether the observed
∆T would increase, decrease or remain the...
asked 1 hour ago -
Based on the range, which of the following sets of scores has
the greatest variability? 3,...
asked 3 hours ago -
Ripples in a pond travel at a velocity of 3 m/s with one peak
passing a...
asked 2 hours ago -
A man stands on the roof of a building of height 13.0 mm and
throws a...
asked 2 hours ago -
The extent to which assets are financed by borrowed funds and
other liabilities is indicated by:...
asked 3 hours ago -
Explain in detail
Germany is the fifth largest economy
explain what goods and services Germany specializes...
asked 4 hours ago -
The density of platinum is 21.45 g/mL. If a cube of platinum
with a mass of...
asked 4 hours ago -
Accounts Receivable
Sales
A/R Posting
Extended Sales Invoice
Packing Slip
Compare invoice to packing slip 2...
asked 4 hours ago -
Michaella, age 23, is a full-time law student and is claimed by
her parents as a...
asked 4 hours ago -
Why are polymers not typically casted into products?
asked 4 hours ago