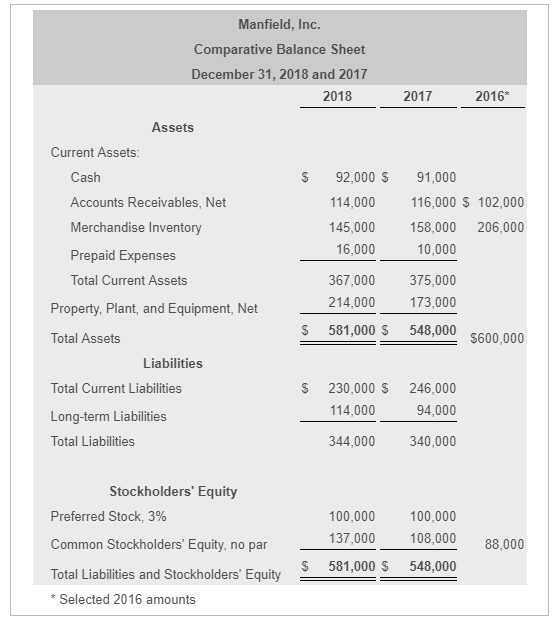
Comparative financial statement data of Manfield, Inc. follow:


Homework Answers
Answer:-
| Sr.No. | Particulars | 2018 | 2017 |
| 1(A) | Current Ratio:-Current Assets/Current Liabilities | 367000/230000 | 375000/246000 |
| Current Ratio:- | 1.596 | 1.524 | |
| 1(B) | Cash Ratio:-Cash+Cash Equivalents/Current Liabilities | 92000/230000 | 91000/246000 |
| 0.4 | 0.370 | ||
| 1( C) | Interest Earned Ratio:-EBIT/Interest Expense | 83000/12000 | 70000/14000 |
| 6.92 | 5 | ||
| 1(D) | Inventory Turnover Ratio:-Cost of Goods Sold/Average Inventory | 243000/ (158000+145000) | 216000/ (158000+206000) |
| 0.802 | 0.593 | ||
| 1( E) | Gross Profit percentage Ratio:-Gross Profit/Sales | 222000/465000 | 207000/423000 |
| 0.477 | 0.489 | ||
| 1(F) | Debt to equity Ratio:-Total Debt/Equity | 114000/137000 | 94000/108000 |
| 0.832 | 0.870 | ||
| 1(G) | Rate of return on common equity | 50000/137000*100 | 29000/108000*100 |
| 36% | 27% | ||
| 1(H) | Earning Per share:-Net Income-Preference stock dividend/No of shares | (50000-3000)/13700 | (29000-3000)/10800 |
| 3.431 | 2.407 | ||
| 1(I) | Price earnings ratio=Market price/Eps | 89.1/3.43 | 37.57/2.41 |
| 25.977 | 15.589 | ||
2.a The debt equity ratio of Manfield Inc has reduced from 0.87 to 0.83 in 2018.So the ability to pay debts has deteriorated.Inventory turnover ratio has increased from 0.593 to 0.802.So the ability to sell inventory has improved.
2b. The EPS of the company has increased from 2.407 to 3.431 and also the PE ratio has increased from 15.589 to 25.977.So the investment attractiveness has increased.
Add Answer to:
Comparative financial statement data of Manfield, Inc.
follow:
Comparative financial statement data of Manfield, Inc. follow:...
Learning Objective 4 P17-27A Using ratios to evaluate a stock investment Comparative financial statement data of...
 Learning Objective 4 P17-27A Using ratios to evaluate a stock investment Comparative financial statement data of Sanfield, Inc. follow. 1. 2018: 48.9% 2017 2016 SANFIELD, INC Comparative Income Statement Years Ended December 31, 2018 and 2017 2018 2017 Net Sales Revenue $462,000 $400,000 Cost of Goods Sold 236,000 213.000 Gross Profit 226,000 217.000 Operating Expenses 135,000 133,000 Income from Operations 91,000 $4,000 Interest Expense 8.000 12.000 Income Before Income Tax 83,000 Income Tax Expense 18.000 22.000 Net Income $65.000 $...
P15-27AUsing ratios to evaluate a stock investment 8. Comparative financial statement data of Sanfield, Inc. follow...
 P15-27AUsing ratios to evaluate a stock investment 8. Comparative financial statement data of Sanfield, Inc. follow 1) SANFIELD, INC. Comparative Balance Sheet December 31, 2018 and 2017 2018 SANFIELD, INC. Comparative Income Statement Years Ended December 31, 2018 and 2017 201 2017 2018 2017 Assets Net Sales Revenue $ 462,000 Curent Aets $ 430,000 $ 97,000 $ 91.000 Cost of Goods Sold Cash 236,000 S 100.b00 207,000 213,000 117,000 10.000 Gross Profit Accounts Receivable, Net 226,000 217,000 164.000 142,000 Merchandse...
can i get help please Canfield, Inc. Comparative Income Statement Years Ended December 31, 2018 and...
 can
i get help please
Canfield, Inc. Comparative Income Statement Years Ended December 31, 2018 and 2017 2018 2017 Net Sales Revenue $ 458,000 $ 427,000 Cost of Goods Sold 234,000 217,000 Gross Profit 224,000 210,000 Operating Expenses 134,000 132,000 Income From Operations 90,000 78,000 Interest Expense 13,000 17,000 Income Before Income Tax 77,000 61,000 Income Tax Expense 20,000 24,000 Net Income $ 57,000 $ 37,000 Print Done Canfield, Inc. Comparative Balance Sheet December 31, 2018 and 2017 Read the...
can
i get help please
Canfield, Inc. Comparative Income Statement Years Ended December 31, 2018 and 2017 2018 2017 Net Sales Revenue $ 458,000 $ 427,000 Cost of Goods Sold 234,000 217,000 Gross Profit 224,000 210,000 Operating Expenses 134,000 132,000 Income From Operations 90,000 78,000 Interest Expense 13,000 17,000 Income Before Income Tax 77,000 61,000 Income Tax Expense 20,000 24,000 Net Income $ 57,000 $ 37,000 Print Done Canfield, Inc. Comparative Balance Sheet December 31, 2018 and 2017 Read the...
Twenty metrics of liquidity, Solvency, and Profitability The comparative financial statements of Automotive Solutions Inc. are...
 Twenty metrics of liquidity, Solvency, and Profitability The comparative financial statements of Automotive Solutions Inc. are as follows. The market price of Automotive Solutions Inc. common stock was $61 on December 31, 2018 AUTOMOTIVE SOLUTIONS INC. Comparative Income Statement For the Years Ended December 31, 2018 and 2017 2018 2017 Sales $3,294,855 $3,035,690 Cost of goods sold (1,199,390) (1,103,440) Gross profit $2,095,465 $1,932,250 Selling expenses $(729,000) $(903,450) Administrative expenses (621,005) (530,600) Total operating expenses (1,350,005) (1,434,050) Operating income $745,450 $498,200...
92 Financial Statement Analysis 7-22 Analyzing profitability Inc.'s comparative income comparative income statement follows. The 2015...
 92 Financial Statement Analysis 7-22 Analyzing profitability Inc.'s comparative income comparative income statement follows. The 2015 data are given as nceded. 1.2017 11.6% VARSITY, INC Comparative Income Statement Years Ended December 31, 2017 and 2016 Dollars in thousands Net Sales Cost of Goods Sold Selling and Administrative Expenses nterest Expense income Tax Expense Net Income 2017 2016 2015 S 185,000 $ 153,000 96,000 87,000 46,500 39,500 9,50010,500 9,000 $ 21,500 S 7,000 11,500 Additional data Total Assets Common Stockholders' Equity...
The 2018 income statement and comparative balance sheet of Get Wired, Inc. follow: EEB (Click the...
 The 2018 income statement and comparative balance sheet of Get Wired, Inc. follow: EEB (Click the icon to view the income statement) ell (Click the icon to view the comparative balance sheet.) Statement of Cash Flows Year Ended December 31, 2018 Cash Flows from Operating Activities: Net Income Adjustments to Reconcile Net Income to Net Cash Provided by (Used for) Operating Activities Net Cash Provided by (Used for) Operating Activities Cash Flows from Investing Activities Net Cash Provided by (Used...
Nineteen Measures of Solvency and Profitability The comparative financial statements of Blige Inc. are as follows....
 Nineteen Measures of Solvency and Profitability The comparative financial statements of Blige Inc. are as follows. The market price of Blige Inc. common stock was $63 on December 31, 2016. Blige Inc. Comparative Retained Earnings Statement For the Years Ended December 31, 2016 and 2015 2016 2015 Retained earnings, January 1 Add net income for year $1,028,375 227,200 $873,425 178,900 $1,052,325 Total $1,255,575 Deduct dividends On preferred stock On common stock Total $7,700 16,250 $7,700 16,250 $23,950 $1,028,375 $23,950 Retained...
The comparative financial statements of Blige Inc. are as follows. The market price of Blige Inc....
The comparative financial statements of Blige Inc. are as follows. The market price of Blige Inc. common stock was $55 on December 31, 2016. Blige Inc. Comparative Retained Earnings Statement For the Years Ended December 31, 2016 and 2015 2016 2015 Retained earnings, January 1 $1,029,350 $873,250 Add net income for year 224,000 178,800 Total $1,253,350 $1,052,050 Deduct dividends On preferred stock $7,700 $7,700 On common stock 15,000 15,000 Total $22,700 $22,700 Retained earnings, December 31 $1,230,650 $1,029,350 Blige Inc....
The 2018 income statement and comparative balance sheet of Rolling Hills, Inc. follow: Rolling Hills, Inc....
The 2018 income statement and comparative balance sheet of Rolling Hills, Inc. follow: Rolling Hills, Inc. Income Statement Year Ended December 31, 2018 Net Sales Revenue $440,000 Cost of Goods Sold 209,200 Gross Profit 230,800 Operating Expenses: Salaries Expense $77,400 Depreciation Expense—Plant Assets 14,400 Other Operating Expenses 10,200 Total Operating Expenses 102,000 Operating Income 128,800 Other Income and (Expenses): Interest Revenue 8,700 Interest Expense (21,100) Total Other Income and (Expenses) (12,400) Net Income Before Income Taxes 116,400 Income Tax Expense...
Nineteen Measures of Solvency and Profitability The comparative financial statements of Blige Inc. are as follows....
 Nineteen Measures of Solvency and Profitability The comparative financial statements of Blige Inc. are as follows. The market price of Blige Inc. common stock was $63 on December 31, 2016. Blige Inc. Comparative Retained Earnings Statement For the Years Ended December 31, 2016 and 2015 2016 2015 Retained earnings, January 1 $1,421,300 Add net income for year 316,800 $1,212,400 248,300 $1,460,700 $1,738,100 Total Deduct dividends On preferred stock On common stock Total $10,500 28,900 $10,500 28,900 $39,400 $39,400 Retained earnings,...
 Learning Objective 4 P17-27A Using ratios to evaluate a stock investment Comparative financial statement data of Sanfield, Inc. follow. 1. 2018: 48.9% 2017 2016 SANFIELD, INC Comparative Income Statement Years Ended December 31, 2018 and 2017 2018 2017 Net Sales Revenue $462,000 $400,000 Cost of Goods Sold 236,000 213.000 Gross Profit 226,000 217.000 Operating Expenses 135,000 133,000 Income from Operations 91,000 $4,000 Interest Expense 8.000 12.000 Income Before Income Tax 83,000 Income Tax Expense 18.000 22.000 Net Income $65.000 $...
 P15-27AUsing ratios to evaluate a stock investment 8. Comparative financial statement data of Sanfield, Inc. follow 1) SANFIELD, INC. Comparative Balance Sheet December 31, 2018 and 2017 2018 SANFIELD, INC. Comparative Income Statement Years Ended December 31, 2018 and 2017 201 2017 2018 2017 Assets Net Sales Revenue $ 462,000 Curent Aets $ 430,000 $ 97,000 $ 91.000 Cost of Goods Sold Cash 236,000 S 100.b00 207,000 213,000 117,000 10.000 Gross Profit Accounts Receivable, Net 226,000 217,000 164.000 142,000 Merchandse...
 can
i get help please
Canfield, Inc. Comparative Income Statement Years Ended December 31, 2018 and 2017 2018 2017 Net Sales Revenue $ 458,000 $ 427,000 Cost of Goods Sold 234,000 217,000 Gross Profit 224,000 210,000 Operating Expenses 134,000 132,000 Income From Operations 90,000 78,000 Interest Expense 13,000 17,000 Income Before Income Tax 77,000 61,000 Income Tax Expense 20,000 24,000 Net Income $ 57,000 $ 37,000 Print Done Canfield, Inc. Comparative Balance Sheet December 31, 2018 and 2017 Read the...
can
i get help please
Canfield, Inc. Comparative Income Statement Years Ended December 31, 2018 and 2017 2018 2017 Net Sales Revenue $ 458,000 $ 427,000 Cost of Goods Sold 234,000 217,000 Gross Profit 224,000 210,000 Operating Expenses 134,000 132,000 Income From Operations 90,000 78,000 Interest Expense 13,000 17,000 Income Before Income Tax 77,000 61,000 Income Tax Expense 20,000 24,000 Net Income $ 57,000 $ 37,000 Print Done Canfield, Inc. Comparative Balance Sheet December 31, 2018 and 2017 Read the...
 Twenty metrics of liquidity, Solvency, and Profitability The comparative financial statements of Automotive Solutions Inc. are as follows. The market price of Automotive Solutions Inc. common stock was $61 on December 31, 2018 AUTOMOTIVE SOLUTIONS INC. Comparative Income Statement For the Years Ended December 31, 2018 and 2017 2018 2017 Sales $3,294,855 $3,035,690 Cost of goods sold (1,199,390) (1,103,440) Gross profit $2,095,465 $1,932,250 Selling expenses $(729,000) $(903,450) Administrative expenses (621,005) (530,600) Total operating expenses (1,350,005) (1,434,050) Operating income $745,450 $498,200...
 92 Financial Statement Analysis 7-22 Analyzing profitability Inc.'s comparative income comparative income statement follows. The 2015 data are given as nceded. 1.2017 11.6% VARSITY, INC Comparative Income Statement Years Ended December 31, 2017 and 2016 Dollars in thousands Net Sales Cost of Goods Sold Selling and Administrative Expenses nterest Expense income Tax Expense Net Income 2017 2016 2015 S 185,000 $ 153,000 96,000 87,000 46,500 39,500 9,50010,500 9,000 $ 21,500 S 7,000 11,500 Additional data Total Assets Common Stockholders' Equity...
 The 2018 income statement and comparative balance sheet of Get Wired, Inc. follow: EEB (Click the icon to view the income statement) ell (Click the icon to view the comparative balance sheet.) Statement of Cash Flows Year Ended December 31, 2018 Cash Flows from Operating Activities: Net Income Adjustments to Reconcile Net Income to Net Cash Provided by (Used for) Operating Activities Net Cash Provided by (Used for) Operating Activities Cash Flows from Investing Activities Net Cash Provided by (Used...
 Nineteen Measures of Solvency and Profitability The comparative financial statements of Blige Inc. are as follows. The market price of Blige Inc. common stock was $63 on December 31, 2016. Blige Inc. Comparative Retained Earnings Statement For the Years Ended December 31, 2016 and 2015 2016 2015 Retained earnings, January 1 Add net income for year $1,028,375 227,200 $873,425 178,900 $1,052,325 Total $1,255,575 Deduct dividends On preferred stock On common stock Total $7,700 16,250 $7,700 16,250 $23,950 $1,028,375 $23,950 Retained...
 Nineteen Measures of Solvency and Profitability The comparative financial statements of Blige Inc. are as follows. The market price of Blige Inc. common stock was $63 on December 31, 2016. Blige Inc. Comparative Retained Earnings Statement For the Years Ended December 31, 2016 and 2015 2016 2015 Retained earnings, January 1 $1,421,300 Add net income for year 316,800 $1,212,400 248,300 $1,460,700 $1,738,100 Total Deduct dividends On preferred stock On common stock Total $10,500 28,900 $10,500 28,900 $39,400 $39,400 Retained earnings,...
Most questions answered within 3 hours.
-
An aspirin dose of 5.0mg per kg of body weight has been
prescribed to reduce the...
asked 44 seconds ago -
The AASB Conceptual Framework (2.12-2.19) refers to ‘faithful
representation’ as being necessary for financial information to...
asked 5 minutes ago -
A U.S. corporation with net receivables in euro could hedge by
_________________.
A. buying euro forward...
asked 7 minutes ago -
Consider the following reversible reaction: CO2 +
H2O <--> H2CO3.In which
direction (right or left) will...
asked 10 minutes ago -
Which of the following probabilities indicates a relationship
that is not statistically significant?
Group of answer...
asked 11 minutes ago -
QUESTION 8
Which layer of the TCP/IP hierarchy presents incoming messages
to the computer user?
a....
asked 18 minutes ago -
A solenoid a cross-sectional area of 5.4x10^-4 m^2, consists of
540 turns per meter, and carries...
asked 29 minutes ago -
Explain some of the pros and cons of converting a C Corporation
into an S Corp?...
asked 33 minutes ago -
The diagram below shows a meter shunted by a parallel resistance
Rs. The maximum value for...
asked 33 minutes ago -
Be sure to answer all parts. A solution contains 0.107 mol of
NaCl dissolved in 9.35...
asked 32 minutes ago -
1. An 25.96 g sample of aluminum is placed on a 45.15 g sample
of copper...
asked 42 minutes ago -
Calculate the mass of p-dichlorobenzene (mm=147.00 g/mol) that
when dissolved in 125 ml cyclohexane (d=0.779 g/mol,...
asked 50 minutes ago