
Homework Answers
1. Compute the following ratios for 2016 and 2015:
a. Current ratio
2015 – 377,000 / 242,000 = 1.55
2016 – 365,000 / 228,000 = 1.60
b. Cash ratio
2015 – 93,000 / 242,000 = 0.384
2016 – 94,000 / 228,000 = 0.412
c. Times-interest-earned ratio
2015: (37,000 + 25,000 + 16,000) / 16000 = 4.875
2016: (57,000 + 23,000 + 10,000) / 10,000 = 9.0
d. Inventory turnover
2015: 214,000 / (160,000 + 210,000) / 2 = 1.157
2016: 237,000 / (145,000 + 160,000) / 2 = 1.554
e. Gross profit percentage
2015: 214,000 / 428,000 = 50%
2016: 228,000 / 465,000 = 49.032%
f. Debt to equity ratio
2015: 340,000 / 215,000 = 1.581
2016: 342,000 / 240,000 = 1.425
g. Rate of return on common stockholders’ equity
2015: (37,000 – 0) / (119,000 + 91,000) / 2 = 0.35 = 35%
2016: (57,000 – 0) / (144,000 + 119,000) / 2 = 0.43 = 43%
h. Earnings per share of common stock
2015: (37,000 – 0) / (11,000 + 11,000) / 2 = 3.36/share
2016: (57,000 – 0) / (13,000 + 11,000) / 2 = 4.75/share
i. Price/earnings ratio
2015: 37.20 / 3.36 = 11.07
2016: 76.67 / 4.75 = 16.14
Add Answer to:
Learning Objective 4 P17-27A Using ratios to evaluate a stock investment Comparative financial statement data of...
P15-27AUsing ratios to evaluate a stock investment 8. Comparative financial statement data of Sanfield, Inc. follow...
 P15-27AUsing ratios to evaluate a stock investment 8. Comparative financial statement data of Sanfield, Inc. follow 1) SANFIELD, INC. Comparative Balance Sheet December 31, 2018 and 2017 2018 SANFIELD, INC. Comparative Income Statement Years Ended December 31, 2018 and 2017 201 2017 2018 2017 Assets Net Sales Revenue $ 462,000 Curent Aets $ 430,000 $ 97,000 $ 91.000 Cost of Goods Sold Cash 236,000 S 100.b00 207,000 213,000 117,000 10.000 Gross Profit Accounts Receivable, Net 226,000 217,000 164.000 142,000 Merchandse...
Comparative financial statement data of Manfield, Inc. follow: Comparative financial statement data of Manfield, Inc. follow:...
 Comparative financial statement data of Manfield, Inc.
follow:
Comparative financial statement data of Manfield, Inc. follow: 囲(Click the icon to view the income statement.) EEE (Click the icon to view the balance sheet.) 1 (Click the icon to view the additional financial information.) Read the requirements Requirement 1a. Compute the current ratios for 2018 and 2017. Begin by selecting the formula to compute the current ratio Current ratio = Manfield, Inc. Comparative Income Statement Years Ended December 31, 2018 and...
Comparative financial statement data of Manfield, Inc.
follow:
Comparative financial statement data of Manfield, Inc. follow: 囲(Click the icon to view the income statement.) EEE (Click the icon to view the balance sheet.) 1 (Click the icon to view the additional financial information.) Read the requirements Requirement 1a. Compute the current ratios for 2018 and 2017. Begin by selecting the formula to compute the current ratio Current ratio = Manfield, Inc. Comparative Income Statement Years Ended December 31, 2018 and...
can i get help please Canfield, Inc. Comparative Income Statement Years Ended December 31, 2018 and...
 can
i get help please
Canfield, Inc. Comparative Income Statement Years Ended December 31, 2018 and 2017 2018 2017 Net Sales Revenue $ 458,000 $ 427,000 Cost of Goods Sold 234,000 217,000 Gross Profit 224,000 210,000 Operating Expenses 134,000 132,000 Income From Operations 90,000 78,000 Interest Expense 13,000 17,000 Income Before Income Tax 77,000 61,000 Income Tax Expense 20,000 24,000 Net Income $ 57,000 $ 37,000 Print Done Canfield, Inc. Comparative Balance Sheet December 31, 2018 and 2017 Read the...
can
i get help please
Canfield, Inc. Comparative Income Statement Years Ended December 31, 2018 and 2017 2018 2017 Net Sales Revenue $ 458,000 $ 427,000 Cost of Goods Sold 234,000 217,000 Gross Profit 224,000 210,000 Operating Expenses 134,000 132,000 Income From Operations 90,000 78,000 Interest Expense 13,000 17,000 Income Before Income Tax 77,000 61,000 Income Tax Expense 20,000 24,000 Net Income $ 57,000 $ 37,000 Print Done Canfield, Inc. Comparative Balance Sheet December 31, 2018 and 2017 Read the...
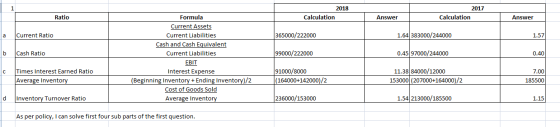
Requirements 1. Compute the following ratios for 2018 and 2017: a. Current ratio b. Cash ratio c. Times-interest-earned...
 Requirements 1. Compute the following ratios for 2018 and 2017: a. Current ratio b. Cash ratio c. Times-interest-earned ratio d. Inventory turnover e. Gross profit percentage f. Debt to equity ratio g. Rate of return on common stockholders' equity h. Earnings per share of common stock I. Pricelearnings ratio 2. Decide (a) whether Tanfield's ability to pay debts and to sell inventory improved or deteriorated during 2018 and (b) whether the investment attractiveness of its common stock appears to have...
Requirement 1a. Compute the current ratios for 2018 and 2017 Begin by selecting the formula to...
 Requirement 1a. Compute the current ratios for 2018 and 2017 Begin by selecting the formula to compute the current ratio Current ratio 1. Compute the following ratios for 2018 and 2017: a. Current ratio b. Cash ratio Times-interest-earned ratio C. d. Inventory turnover Gross profit percentage f. Debt to equity ratio g. Rate of return on common stockholders' equity h. Earnings per share of common stock i. Price/earnings ratio Decide (a) whether Dangerfield's ability to pay debts and to sell...
Twenty metrics of liquidity, Solvency, and Profitability The comparative financial statements of Automotive Solutions Inc. are...
 Twenty metrics of liquidity, Solvency, and Profitability The comparative financial statements of Automotive Solutions Inc. are as follows. The market price of Automotive Solutions Inc. common stock was $61 on December 31, 2018 AUTOMOTIVE SOLUTIONS INC. Comparative Income Statement For the Years Ended December 31, 2018 and 2017 2018 2017 Sales $3,294,855 $3,035,690 Cost of goods sold (1,199,390) (1,103,440) Gross profit $2,095,465 $1,932,250 Selling expenses $(729,000) $(903,450) Administrative expenses (621,005) (530,600) Total operating expenses (1,350,005) (1,434,050) Operating income $745,450 $498,200...
QUESTION 3 From following financial statements, calculate following ratios and analyse the current year and previous...
 QUESTION 3 From following financial statements, calculate following ratios and analyse the current year and previous year performance a) Current ratio. b) Days sales outstanding (DSO). (Sales 2017 RM500m & Sales 2018 RM600m) c) Inventory turnover ratio d) Total debt to assets e) Return on assets (ROA) (Net income 2017 RM42m &Net income 2018 RM58m) Moon Inc. Balance Sheet (RM millions) as at December 31, 2015 and 2016 2015 21 51 2016 20 84 Cash Accounts receivable Inventory Prepaid expenses...
Nineteen Measures of Solvency and Profitability The comparative financial statements of Blige Inc. are as follows....
 Nineteen Measures of Solvency and Profitability The comparative financial statements of Blige Inc. are as follows. The market price of Blige Inc. common stock was $63 on December 31, 2016. Blige Inc. Comparative Retained Earnings Statement For the Years Ended December 31, 2016 and 2015 2016 2015 Retained earnings, January 1 Add net income for year $1,028,375 227,200 $873,425 178,900 $1,052,325 Total $1,255,575 Deduct dividends On preferred stock On common stock Total $7,700 16,250 $7,700 16,250 $23,950 $1,028,375 $23,950 Retained...
92 Financial Statement Analysis 7-22 Analyzing profitability Inc.'s comparative income comparative income statement follows. The 2015...
 92 Financial Statement Analysis 7-22 Analyzing profitability Inc.'s comparative income comparative income statement follows. The 2015 data are given as nceded. 1.2017 11.6% VARSITY, INC Comparative Income Statement Years Ended December 31, 2017 and 2016 Dollars in thousands Net Sales Cost of Goods Sold Selling and Administrative Expenses nterest Expense income Tax Expense Net Income 2017 2016 2015 S 185,000 $ 153,000 96,000 87,000 46,500 39,500 9,50010,500 9,000 $ 21,500 S 7,000 11,500 Additional data Total Assets Common Stockholders' Equity...
Nineteen Measures of Solvency and Profitability The comparative financial statements of Blige Inc. are as follows....
Nineteen Measures of Solvency and Profitability The comparative financial statements of Blige Inc. are as follows. The market price of Blige Inc. common stock was $64 on December 31, 2016. Blige Inc. Comparative Retained Earnings Statement For the Years Ended December 31, 2016 and 2015 2016 2015 Retained earnings, January 1 $4,221,375 $3,569,725 Add net income for year 976,800 731,200 Total $5,198,175 $4,300,925 Deduct dividends On preferred stock $12,600 $12,600 On common stock 66,950 66,950 Total $79,550 $79,550 Retained earnings,...
 P15-27AUsing ratios to evaluate a stock investment 8. Comparative financial statement data of Sanfield, Inc. follow 1) SANFIELD, INC. Comparative Balance Sheet December 31, 2018 and 2017 2018 SANFIELD, INC. Comparative Income Statement Years Ended December 31, 2018 and 2017 201 2017 2018 2017 Assets Net Sales Revenue $ 462,000 Curent Aets $ 430,000 $ 97,000 $ 91.000 Cost of Goods Sold Cash 236,000 S 100.b00 207,000 213,000 117,000 10.000 Gross Profit Accounts Receivable, Net 226,000 217,000 164.000 142,000 Merchandse...
 Comparative financial statement data of Manfield, Inc.
follow:
Comparative financial statement data of Manfield, Inc. follow: 囲(Click the icon to view the income statement.) EEE (Click the icon to view the balance sheet.) 1 (Click the icon to view the additional financial information.) Read the requirements Requirement 1a. Compute the current ratios for 2018 and 2017. Begin by selecting the formula to compute the current ratio Current ratio = Manfield, Inc. Comparative Income Statement Years Ended December 31, 2018 and...
Comparative financial statement data of Manfield, Inc.
follow:
Comparative financial statement data of Manfield, Inc. follow: 囲(Click the icon to view the income statement.) EEE (Click the icon to view the balance sheet.) 1 (Click the icon to view the additional financial information.) Read the requirements Requirement 1a. Compute the current ratios for 2018 and 2017. Begin by selecting the formula to compute the current ratio Current ratio = Manfield, Inc. Comparative Income Statement Years Ended December 31, 2018 and...
 can
i get help please
Canfield, Inc. Comparative Income Statement Years Ended December 31, 2018 and 2017 2018 2017 Net Sales Revenue $ 458,000 $ 427,000 Cost of Goods Sold 234,000 217,000 Gross Profit 224,000 210,000 Operating Expenses 134,000 132,000 Income From Operations 90,000 78,000 Interest Expense 13,000 17,000 Income Before Income Tax 77,000 61,000 Income Tax Expense 20,000 24,000 Net Income $ 57,000 $ 37,000 Print Done Canfield, Inc. Comparative Balance Sheet December 31, 2018 and 2017 Read the...
can
i get help please
Canfield, Inc. Comparative Income Statement Years Ended December 31, 2018 and 2017 2018 2017 Net Sales Revenue $ 458,000 $ 427,000 Cost of Goods Sold 234,000 217,000 Gross Profit 224,000 210,000 Operating Expenses 134,000 132,000 Income From Operations 90,000 78,000 Interest Expense 13,000 17,000 Income Before Income Tax 77,000 61,000 Income Tax Expense 20,000 24,000 Net Income $ 57,000 $ 37,000 Print Done Canfield, Inc. Comparative Balance Sheet December 31, 2018 and 2017 Read the...
 Requirements 1. Compute the following ratios for 2018 and 2017: a. Current ratio b. Cash ratio c. Times-interest-earned ratio d. Inventory turnover e. Gross profit percentage f. Debt to equity ratio g. Rate of return on common stockholders' equity h. Earnings per share of common stock I. Pricelearnings ratio 2. Decide (a) whether Tanfield's ability to pay debts and to sell inventory improved or deteriorated during 2018 and (b) whether the investment attractiveness of its common stock appears to have...
 Requirement 1a. Compute the current ratios for 2018 and 2017 Begin by selecting the formula to compute the current ratio Current ratio 1. Compute the following ratios for 2018 and 2017: a. Current ratio b. Cash ratio Times-interest-earned ratio C. d. Inventory turnover Gross profit percentage f. Debt to equity ratio g. Rate of return on common stockholders' equity h. Earnings per share of common stock i. Price/earnings ratio Decide (a) whether Dangerfield's ability to pay debts and to sell...
 Twenty metrics of liquidity, Solvency, and Profitability The comparative financial statements of Automotive Solutions Inc. are as follows. The market price of Automotive Solutions Inc. common stock was $61 on December 31, 2018 AUTOMOTIVE SOLUTIONS INC. Comparative Income Statement For the Years Ended December 31, 2018 and 2017 2018 2017 Sales $3,294,855 $3,035,690 Cost of goods sold (1,199,390) (1,103,440) Gross profit $2,095,465 $1,932,250 Selling expenses $(729,000) $(903,450) Administrative expenses (621,005) (530,600) Total operating expenses (1,350,005) (1,434,050) Operating income $745,450 $498,200...
 QUESTION 3 From following financial statements, calculate following ratios and analyse the current year and previous year performance a) Current ratio. b) Days sales outstanding (DSO). (Sales 2017 RM500m & Sales 2018 RM600m) c) Inventory turnover ratio d) Total debt to assets e) Return on assets (ROA) (Net income 2017 RM42m &Net income 2018 RM58m) Moon Inc. Balance Sheet (RM millions) as at December 31, 2015 and 2016 2015 21 51 2016 20 84 Cash Accounts receivable Inventory Prepaid expenses...
 Nineteen Measures of Solvency and Profitability The comparative financial statements of Blige Inc. are as follows. The market price of Blige Inc. common stock was $63 on December 31, 2016. Blige Inc. Comparative Retained Earnings Statement For the Years Ended December 31, 2016 and 2015 2016 2015 Retained earnings, January 1 Add net income for year $1,028,375 227,200 $873,425 178,900 $1,052,325 Total $1,255,575 Deduct dividends On preferred stock On common stock Total $7,700 16,250 $7,700 16,250 $23,950 $1,028,375 $23,950 Retained...
 92 Financial Statement Analysis 7-22 Analyzing profitability Inc.'s comparative income comparative income statement follows. The 2015 data are given as nceded. 1.2017 11.6% VARSITY, INC Comparative Income Statement Years Ended December 31, 2017 and 2016 Dollars in thousands Net Sales Cost of Goods Sold Selling and Administrative Expenses nterest Expense income Tax Expense Net Income 2017 2016 2015 S 185,000 $ 153,000 96,000 87,000 46,500 39,500 9,50010,500 9,000 $ 21,500 S 7,000 11,500 Additional data Total Assets Common Stockholders' Equity...
Most questions answered within 3 hours.
-
Bright Sun, Inc. sold an issue of 30-year $1,000 par value bonds
to the public. The...
asked 9 seconds from now -
To be done in java code. 2 words are anagrams if 1 word can be
formed...
asked 2 minutes ago -
The income statement for the month of June, 2014 of Happy Smiles
Enterprises contains the following...
asked 5 minutes ago -
1-Calculate the mass in grams of 2.55 moles of KCl
2- Calculate how many moles are...
asked 5 minutes ago -
1. Choose value for p between 0.20 and 0.80. It should have at
least two decimal...
asked 6 minutes ago -
QUESTIONS: 500 words for the question
In defining abnormality, the criteria of “deviance”, “distress”
and “dysfunction”...
asked 8 minutes ago -
A sample of n = 25 scores produces a t statistic of t =
-2.062. If...
asked 26 minutes ago -
Given the following, compute the after tax cost of debt: The par
value of the firms...
asked 19 minutes ago -
Coding in C. Please only use stdio.h (which would mean no malloc
or anything like that)...
asked 25 minutes ago -
Use the fundamental accounting equation to find the missing
amounts.
Scenario
Assets
Liabilities
Equity
1
$...
asked 23 minutes ago -
A population has a mean of 200 and a standard deviation of 60.
Suppose a sample...
asked 27 minutes ago -
A bicyclist starting at rest produces a constant angular
acceleration of 1.10 rad/s2 for wheels that...
asked 41 minutes ago