Short-run supply and long-run equilibrium, please and thank you


Homework Answers
| P | QS-1 FIRM | QS-20 FIRMS | 30 FIRMS | 40 FIRMS |
| 10 | 0 | 0 | 0 | 0 |
| 15 | 15000 | 300000 | 450000 | 600000 |
| 30 | 20000 | 400000 | 600000 | 800000 |
| 40 | 22500 | 450000 | 675000 | 900000 |
| 70 | 27500 | 550000 | 825000 | 1100000 |
| 90 | 30000 | 600000 | 900000 | 1200000 |

Blanks-
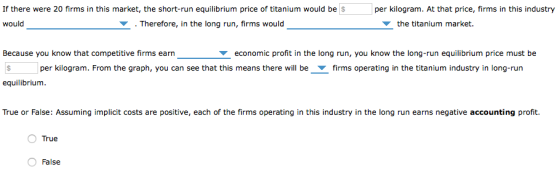
1) 40
2) positive economic profits
3) enter
4) zero
5) 30
6) 30
The statement is False
Add Answer to:
Short-run supply and long-run equilibrium, please and
thank you
Consider the competitive market for titanium. Assume...
5. Short-run supply and long-run equilibrium Consider the competitive market for titanium. Assume that, regardless of...
 5. Short-run supply and long-run
equilibrium
Consider the competitive market for titanium. Assume that,
regardless of how many firms are in the industry, every firm in the
industry is identical and faces the marginal cost (MC), average
total cost (ATC), and average variable cost (AVC) curves shown on
the following graph.
Consider the competitive market for titanium. Assume that, regardless of how many firms are in the industry, every firm in the industry is identical and faces the marginal cost...
5. Short-run supply and long-run
equilibrium
Consider the competitive market for titanium. Assume that,
regardless of how many firms are in the industry, every firm in the
industry is identical and faces the marginal cost (MC), average
total cost (ATC), and average variable cost (AVC) curves shown on
the following graph.
Consider the competitive market for titanium. Assume that, regardless of how many firms are in the industry, every firm in the industry is identical and faces the marginal cost...
7. Short-run supply and long-run equilibrium Aa Aa Consider a perfectly competitive market for titanium. Assume...
 7. Short-run supply and long-run equilibrium Aa Aa Consider a perfectly competitive market for titanium. Assume that all firms in the industry are identical and have the marginal cost (MC), average total cost (ATC), and average variable cost (AVC) curves shown on the following graph. Assume also that it does not matter how many firms are in the industry. Tool Tip: Place the mouse cursor over orange square points on the MC curve to see coordinates. COSTS (Dollars per kilogram...
7. Short-run supply and long-run equilibrium Consider the competitive market for titanium. Assume that, regardless of...
 7. Short-run supply and long-run equilibrium Consider the competitive market for titanium. Assume that, regardless of how many firms are in the industry, every firm in the industry is identi and faces the marginal cost (MC), average total cost (ATC), and average variable cost (AVC) curves shown on the following graph. COSTS (Dollars per pound) AVC мс о OFFFFF 0 3 6 9 12 15 18 21 24 QUANTITY (Thousands of pounds) 27 30 The following diagram shows the market...
7. Short-run supply and long-run equilibrium Consider the competitive market for titanium. Assume that, regardless of...
 7. Short-run supply and long-run equilibrium Consider the competitive market for titanium. Assume that, regardless of how many firms are in the industry, every firm in the industry is identical and faces the marginal cost (MC), average total cost (ATC), and average variable cost (AVC) curves shown on the following graph. COSTS (Dollars per pound) + MC O AVC 0 5 45 50 10 15 20 25 30 35 40 QUANTITY (Thousands of pounds) The following diagram shows the market...
5. Short-run supply and long-run equilibrium Consider the competitive market for titanium. Assume that, regardless of...
 5. Short-run supply and long-run equilibrium Consider the competitive market for titanium. Assume that, regardless of how many firms are in the industry, every firm in the industry is identical and faces the marginal cost (MC), average total cost (ATC), and average variable cost (AVC) curves shown on the following graph. 16, 52 COSTS (Dollars per pound) AVC + D + 0 + 3 MC D + + + + + + + 6 9 12 15 18 21 24...
7. Short-run supply and long-run equilibrium Consider the competitive market for titanium. Assume that, regardless of...
 7. Short-run supply and long-run equilibrium Consider the competitive market for titanium. Assume that, regardless of how many firms are in the industry, every firm in the industry is identical and faces the marginal cost (MC), average total cost (ATC), and average variable cost (AVC) curves shown on the following graph. 100 T 90 - 80 60 50 40 30 20 0 5 10 15 20 25 30 35 4045 50 QUANTITY (Thousands of pounds) The following diagram shows the...
7. Short-run supply and long-run equilibrium Consider the competitive market for titanium. Assume that, regardless of...
 7. Short-run supply and long-run equilibrium Consider the competitive market for titanium. Assume that, regardless of how many firms are in the industry, every firm in the industry is identical and faces the marginal cost (MC), average total cost (ATC), and average variable cost (AVC) curves shown on the following graph. 100 90 80 70 80 50 40 30 30, 15 20 AVC 10 102030405060 708090100 QUANTITY (Thousands of pounds) The following diagram shows the market demand for titanium Use...
Please help!!! 7. Short-run supply and long-run equilibrium Consider the competitive market for titanlum. Assume that,...
 Please help!!!
7. Short-run supply and long-run equilibrium Consider the competitive market for titanlum. Assume that, regardless of how many firms are in the Industry, every firm in the industry is identical and faces the marginal cost (MC), average total cost (ATC), and average variable cost (AVC) curves shown on the following graph. 100 T 90 80 70 50 40 30 20 AVC 10 0 10 20 30 40 0 70 80 0 100 The following diagram shows the market...
Please help!!!
7. Short-run supply and long-run equilibrium Consider the competitive market for titanlum. Assume that, regardless of how many firms are in the Industry, every firm in the industry is identical and faces the marginal cost (MC), average total cost (ATC), and average variable cost (AVC) curves shown on the following graph. 100 T 90 80 70 50 40 30 20 AVC 10 0 10 20 30 40 0 70 80 0 100 The following diagram shows the market...
5. Short-run supply and long-run equilibrium Consider the perfectly competitive market for steel. Assume that, regardless...
 5. Short-run supply and long-run equilibrium Consider the perfectly competitive market for steel. Assume that, regardless of how many firms are in the industry, every firm in the industry is identical and faces the marginal cost (MC), average total cost (ATC), and average variable cost (AVC) curves shown on the following graph. COSTS (Dollars per ton) + MC D AVC 0 10 90 100 20 30 40 50 60 70 80 QUANTITY (Thousands of tons) The following diagram shows the...
7. Short-run supply and long-run equilibrium Consider the competitive market for copper. Assume that, regardless of...
 7. Short-run supply and long-run equilibrium Consider the competitive market for copper. Assume that, regardless of how many firms are in the industry, every firm in the industry is identical and faces the marginal cost (MC), average total cost (ATC), and average variable cost (AVC) curves shown on the following graph. COSTS (Dollars per pound) MC D AVC 0 + 0 + 10 + + + + + + + 20 30 40 50 60 70 80 QUANTITY (Thousands of...
 5. Short-run supply and long-run
equilibrium
Consider the competitive market for titanium. Assume that,
regardless of how many firms are in the industry, every firm in the
industry is identical and faces the marginal cost (MC), average
total cost (ATC), and average variable cost (AVC) curves shown on
the following graph.
Consider the competitive market for titanium. Assume that, regardless of how many firms are in the industry, every firm in the industry is identical and faces the marginal cost...
5. Short-run supply and long-run
equilibrium
Consider the competitive market for titanium. Assume that,
regardless of how many firms are in the industry, every firm in the
industry is identical and faces the marginal cost (MC), average
total cost (ATC), and average variable cost (AVC) curves shown on
the following graph.
Consider the competitive market for titanium. Assume that, regardless of how many firms are in the industry, every firm in the industry is identical and faces the marginal cost...
 7. Short-run supply and long-run equilibrium Aa Aa Consider a perfectly competitive market for titanium. Assume that all firms in the industry are identical and have the marginal cost (MC), average total cost (ATC), and average variable cost (AVC) curves shown on the following graph. Assume also that it does not matter how many firms are in the industry. Tool Tip: Place the mouse cursor over orange square points on the MC curve to see coordinates. COSTS (Dollars per kilogram...
 7. Short-run supply and long-run equilibrium Consider the competitive market for titanium. Assume that, regardless of how many firms are in the industry, every firm in the industry is identi and faces the marginal cost (MC), average total cost (ATC), and average variable cost (AVC) curves shown on the following graph. COSTS (Dollars per pound) AVC мс о OFFFFF 0 3 6 9 12 15 18 21 24 QUANTITY (Thousands of pounds) 27 30 The following diagram shows the market...
 7. Short-run supply and long-run equilibrium Consider the competitive market for titanium. Assume that, regardless of how many firms are in the industry, every firm in the industry is identical and faces the marginal cost (MC), average total cost (ATC), and average variable cost (AVC) curves shown on the following graph. COSTS (Dollars per pound) + MC O AVC 0 5 45 50 10 15 20 25 30 35 40 QUANTITY (Thousands of pounds) The following diagram shows the market...
 5. Short-run supply and long-run equilibrium Consider the competitive market for titanium. Assume that, regardless of how many firms are in the industry, every firm in the industry is identical and faces the marginal cost (MC), average total cost (ATC), and average variable cost (AVC) curves shown on the following graph. 16, 52 COSTS (Dollars per pound) AVC + D + 0 + 3 MC D + + + + + + + 6 9 12 15 18 21 24...
 7. Short-run supply and long-run equilibrium Consider the competitive market for titanium. Assume that, regardless of how many firms are in the industry, every firm in the industry is identical and faces the marginal cost (MC), average total cost (ATC), and average variable cost (AVC) curves shown on the following graph. 100 T 90 - 80 60 50 40 30 20 0 5 10 15 20 25 30 35 4045 50 QUANTITY (Thousands of pounds) The following diagram shows the...
 7. Short-run supply and long-run equilibrium Consider the competitive market for titanium. Assume that, regardless of how many firms are in the industry, every firm in the industry is identical and faces the marginal cost (MC), average total cost (ATC), and average variable cost (AVC) curves shown on the following graph. 100 90 80 70 80 50 40 30 30, 15 20 AVC 10 102030405060 708090100 QUANTITY (Thousands of pounds) The following diagram shows the market demand for titanium Use...
 Please help!!!
7. Short-run supply and long-run equilibrium Consider the competitive market for titanlum. Assume that, regardless of how many firms are in the Industry, every firm in the industry is identical and faces the marginal cost (MC), average total cost (ATC), and average variable cost (AVC) curves shown on the following graph. 100 T 90 80 70 50 40 30 20 AVC 10 0 10 20 30 40 0 70 80 0 100 The following diagram shows the market...
Please help!!!
7. Short-run supply and long-run equilibrium Consider the competitive market for titanlum. Assume that, regardless of how many firms are in the Industry, every firm in the industry is identical and faces the marginal cost (MC), average total cost (ATC), and average variable cost (AVC) curves shown on the following graph. 100 T 90 80 70 50 40 30 20 AVC 10 0 10 20 30 40 0 70 80 0 100 The following diagram shows the market...
 5. Short-run supply and long-run equilibrium Consider the perfectly competitive market for steel. Assume that, regardless of how many firms are in the industry, every firm in the industry is identical and faces the marginal cost (MC), average total cost (ATC), and average variable cost (AVC) curves shown on the following graph. COSTS (Dollars per ton) + MC D AVC 0 10 90 100 20 30 40 50 60 70 80 QUANTITY (Thousands of tons) The following diagram shows the...
 7. Short-run supply and long-run equilibrium Consider the competitive market for copper. Assume that, regardless of how many firms are in the industry, every firm in the industry is identical and faces the marginal cost (MC), average total cost (ATC), and average variable cost (AVC) curves shown on the following graph. COSTS (Dollars per pound) MC D AVC 0 + 0 + 10 + + + + + + + 20 30 40 50 60 70 80 QUANTITY (Thousands of...
Most questions answered within 3 hours.
-
You roll a fair 6-sided dice, let Y be the outcome of the dice
roll. Then...
asked 27 minutes ago -
If the value of the range is equal to zero, then this indicates
that:
A. there...
asked 48 minutes ago -
Based on Simms' (1994) articulation of psychological privacy to
promote development of self-identity, for example, do...
asked 10 minutes ago -
Use C programe to :
Develop an algorithm, flow chart and write a C program to...
asked 33 minutes ago -
Benzene has a vapor pressure of 75.0 Torr at 22.0 °C and an
enthalpy of evaporation...
asked 16 minutes ago -
How does a leadership philosophy shape service delivery in a
human services organization?
asked 26 minutes ago -
Which of the following statements about hormonal regulation of
glycogen synthesis and degradation are correct?
Multiple...
asked 31 minutes ago -
1. Describe all
necessary steps and conditions for execution of a java".
2. What
is maven...
asked 43 minutes ago -
What is the temperature of a 3.5L container with 1.502 mol
carbon dioxide at 10.76 atm?...
asked 38 minutes ago -
A dragster makes a pass down a track in exactly 7.03 seconds.
You do not know,...
asked 42 minutes ago -
What evidence can you provide to illustrate why
crowdsourcing is able to reduce system development costs?...
asked 47 minutes ago -
Hi, I was wondering if I could get some help on a java program
that I...
asked 53 minutes ago