


Homework Answers
(1)
Revenue as % of GDP = (Revenue / GDP) x 100%
Expenditure as % of GDP = (Expenditure / GDP) x 100%
Data table:
| Year | Revenue | Expenditure | GDP | Revenue/GDP | Expenditure/GDP |
| 1998 | 1,722 | 1,653 | 8,747 | 20% | 19% |
| 2000 | 2,025 | 1,789 | 9,817 | 21% | 18% |
| 2002 | 1,853 | 2,011 | 10,470 | 18% | 19% |
| 2004 | 1,880 | 2,293 | 11,686 | 16% | 20% |
| 2006 | 2,407 | 2,655 | 13,178 | 18% | 20% |
Graph:
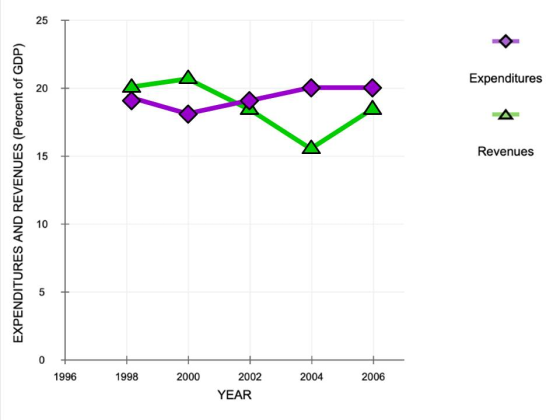
(2) Budget was in deficit when Revenue < Expenditure, in years 2002, 2004 and 2006.
(3) In 2000, national debt decreased by $236 Billion by 242.03%.
National debt in year N = National debt in year (N - 1) + (Expenditure - Revenue)year N
In 1998, National debt = 1,653 - 1,722 = - 69
In 2000, National debt = - 69 + (1,789 - 2,025) = - 305
Decrease in national debt = - 69 - (- 305) = - 69 + 305 = 236
% Decrease in national debt = (236 / 69) - 1 = 3.4203 - 1 = 2.4203 = 242.03%.
Add Answer to:
10. Budget balances and the national debt The following table lists federal expenditures, revenues, and GDP...
2. Budget balances and the national debt The following table lists federal outlays, revenues, and GDP...
 2. Budget balances and the national debt The following table lists federal outlays, revenues, and GDP for the U.S. economy during several years. Revenues (Billions of dollars) 2,025 Outlays (Billions of dollars) GDP (Billions of dollars) Year 2000 1,789 9,817 2001 1,991 10,128 1,853 10,470 2002 2003 1,863 2,011 2,160 2,293 1,783 10,961 2004 1,880 11,686 Plot the data for revenues and outlays as a percentage of GDP on the following graph, rounded to the nearest percent. Use the purple...
1. The federal budget The following table lists federal expenditures, revenues, and GDP for the U.S....
 1. The federal budget The following table lists federal expenditures, revenues, and GDP for the U.S. economy during several years. All numbers are in billions of dollars Year Revenues Expenditures GDP 2000 2001 2002 2003 2004 2,025 1,991 1,853 1,783 1,880 1,789 1,863 2,011 2,160 2,293 9,817 10,128 10,470 10,961 11,686 Plot the data for revenues and expenditures as a percentage of GDP on the following graph, rounded to the nearest percent. Use the purple points (diamond symbol) for expenditures...
5. Automatic adjustments to the government budget The following table provides some information on government expenditures (G) and tax revenues (T) at different levels of real GDP in a hypothetic...
 5. Automatic adjustments to the government budget The following table provides some information on government expenditures (G) and tax revenues (T) at different levels of real GDP in a hypothetical economy. Throughout this problem you should assume that government transfers (TR) are zero. Real GDP (Billions of dollars) 460 Government Expenditures (G) (Billions of dollars) 72 72 72 Tax Revenues (T) (Billions of dollars) 70 72 74 540 Use the blue line (circle symbols) to plot the government expenditures schedule...
Year 2000 GDP Deflator (Price Index, 2009 = 100) 81.9 83.8 85.0 2001 2002 2003 2004...
 Year 2000 GDP Deflator (Price Index, 2009 = 100) 81.9 83.8 85.0 2001 2002 2003 2004 2005 & 2007 Nominal GDP (in Billions of Dollars) 9,817 10.128 10.469 10,960 11,685 12,422 13,178 13,808 14,291 13,939 14,524 15,518 16,163 16,768 17,393 18,037 18,569 2008 2009 2010 2011 2012 2013 2014 2015 2016 100.0 101.2 103.3 105.2 106.7 108.8 110.0 111.4 Instructions: Enter your responses rounded to the nearest billion. a. Calculate real GDP for 2015 using 2007 prices. $0 billion b....
 2. Budget balances and the national debt The following table lists federal outlays, revenues, and GDP for the U.S. economy during several years. Revenues (Billions of dollars) 2,025 Outlays (Billions of dollars) GDP (Billions of dollars) Year 2000 1,789 9,817 2001 1,991 10,128 1,853 10,470 2002 2003 1,863 2,011 2,160 2,293 1,783 10,961 2004 1,880 11,686 Plot the data for revenues and outlays as a percentage of GDP on the following graph, rounded to the nearest percent. Use the purple...
 1. The federal budget The following table lists federal expenditures, revenues, and GDP for the U.S. economy during several years. All numbers are in billions of dollars Year Revenues Expenditures GDP 2000 2001 2002 2003 2004 2,025 1,991 1,853 1,783 1,880 1,789 1,863 2,011 2,160 2,293 9,817 10,128 10,470 10,961 11,686 Plot the data for revenues and expenditures as a percentage of GDP on the following graph, rounded to the nearest percent. Use the purple points (diamond symbol) for expenditures...
 5. Automatic adjustments to the government budget The following table provides some information on government expenditures (G) and tax revenues (T) at different levels of real GDP in a hypothetical economy. Throughout this problem you should assume that government transfers (TR) are zero. Real GDP (Billions of dollars) 460 Government Expenditures (G) (Billions of dollars) 72 72 72 Tax Revenues (T) (Billions of dollars) 70 72 74 540 Use the blue line (circle symbols) to plot the government expenditures schedule...
 Year 2000 GDP Deflator (Price Index, 2009 = 100) 81.9 83.8 85.0 2001 2002 2003 2004 2005 & 2007 Nominal GDP (in Billions of Dollars) 9,817 10.128 10.469 10,960 11,685 12,422 13,178 13,808 14,291 13,939 14,524 15,518 16,163 16,768 17,393 18,037 18,569 2008 2009 2010 2011 2012 2013 2014 2015 2016 100.0 101.2 103.3 105.2 106.7 108.8 110.0 111.4 Instructions: Enter your responses rounded to the nearest billion. a. Calculate real GDP for 2015 using 2007 prices. $0 billion b....
Most questions answered within 3 hours.
-
Which aqueous solution below is most acidic?
a. pH= 3.00
c. [-OH]= 2 x 10^-3
b....
asked 10 minutes ago -
There are four (4) major financial statements: Income Statement,
Retained Earning (Owner's Equity) Statement, Balance Sheet,...
asked 15 minutes ago -
A) Banana, Inc. has a book value per share of $8.70, earnings
per share of $1.68,...
asked 16 minutes ago -
a.)Suppose you were
preparing 1.0 L of a bleaching solution in a volumetric flask, and
it...
asked 26 minutes ago -
write a personal statement of 500 words on the impact you strive
to make using a...
asked 18 minutes ago -
At 25.0 mL sample of 0.100 M HClO (aq) is titrated with NaOH
(aq). What is...
asked 33 minutes ago -
Mark launders his white clothes using the production
function
q=2B +G,
where B is the number...
asked 48 minutes ago -
the flowing is true or fuels with correct
Catalyst may change chemically but remains unchanged
physically
asked 1 hour ago -
Week 9: Leadership
1. Define what is meant by the terms ‘leader’ and ‘leadership’.
Why is...
asked 1 hour ago -
Choose a point at random in the square withsides 0≤x≤1and0≤y≤1.
This means that the probabilitythat the...
asked 1 hour ago -
Generally, for losses arising in tax years after 2017, the NOL
deduction cannot exceed ______.
asked 1 hour ago -
Can you help with how to answer 8 and 9? I do not see those 2...
asked 1 hour ago