
Homework Answers
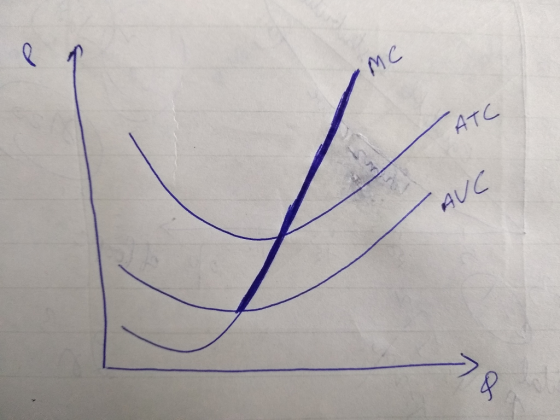
Firms's supply curve is the portion of marginal cost curve which lies above the average variable cost curve. I have marked that portion of marginal cost as bold.
Add Answer to:
ATC AVC The figure above represents a firm's marginal cost, average variable cost, and average total...
P M C ATC Av In the graph above, MC is the firm's marginal cost curve, ATC is the firm's average total cost curve,...
 P M C ATC Av In the graph above, MC is the firm's marginal cost curve, ATC is the firm's average total cost curve, and AVC is the firm's average variable cost curve. If the firm faces a price between P1 and P2: the firm will stay open in both the short run and the long run. the firm will stay open in the short run but close in the long run. the firm will close in both the short...
In the graph above, MC is the firm's marginal cost curve, ATC is the firm's average...
 In the graph above, MC is the firm's marginal cost curve, ATC is
the firm's average total cost curve, and AVC is the firm's average
variable cost curve. If the firm faces a price between P1 and
P2:
the firm will stay open in both the short run and the long
run.
the firm will stay open in the short run but close in the long
run.
the firm will close in both the short and long run.
- -...
In the graph above, MC is the firm's marginal cost curve, ATC is
the firm's average total cost curve, and AVC is the firm's average
variable cost curve. If the firm faces a price between P1 and
P2:
the firm will stay open in both the short run and the long
run.
the firm will stay open in the short run but close in the long
run.
the firm will close in both the short and long run.
- -...
In the graph above, MC is the firm's marginal cost curve, ATC is the firm's average...
 In the graph above, MC is the firm's marginal cost curve, ATC is
the firm's average total cost curve, and AVC is the firm's average
variable cost curve. If the firm faces a price greater than P2,
then
the firm will stay open in both the short and the long run.
the firm will stay open in the short run, but close in the long
run.
the firm will close in both the short and the long run.
Ате 12...
In the graph above, MC is the firm's marginal cost curve, ATC is
the firm's average total cost curve, and AVC is the firm's average
variable cost curve. If the firm faces a price greater than P2,
then
the firm will stay open in both the short and the long run.
the firm will stay open in the short run, but close in the long
run.
the firm will close in both the short and the long run.
Ате 12...
The graph below shows the marginal cost (MC), average variable cost (AVC), and average total cost (ATC) curves for a firm in a competitive market. These curves imply a short-run supply curve that has two distinct parts. One part, not shown, lies along the
 The graph below shows the marginal cost (MC), average variable cost (AVC), and average total cost (ATC) curves for a firm in a competitive market. These curves imply a short-run supply curve that has two distinct parts. One part, not shown, lies along the vertical axis (quantity = 0); this represents a condition of production shutdown. Where is the other part? Use the straight-line tool to draw it.
12.00 Lauren grows grapes. Her average variable cost (AVC), average total cost (ATC), and marginal cost...
 12.00 Lauren grows grapes. Her average variable cost (AVC), average total cost (ATC), and marginal cost (MC) of production are illustrated in the figure to the right. 11.00 Assume the market for grapes is perfectly competitive and that the market price is $2.00 per crate. MC Characterize Lauren's economic profits. Assume she produces such that she maximizes profits in the short run. ATC Using the rectangle drawing tool, shade in Lauren's economic profits. Attach the correct label to indicate whether...
In the graph above, MC is the firm's marginal cost curve, ATC is the firm's average...
 In the graph above, MC is the firm's marginal cost curve, ATC is
the firm's average total cost curve, and AVC is the firm's average
variable cost curve. If the equilibrium price in this market is
above P2, then
firms will exit this market in the long run.
firms will enter this market in the long run.
the number of firms in this market will not change in the long
run.
- Ave
In the graph above, MC is the firm's marginal cost curve, ATC is
the firm's average total cost curve, and AVC is the firm's average
variable cost curve. If the equilibrium price in this market is
above P2, then
firms will exit this market in the long run.
firms will enter this market in the long run.
the number of firms in this market will not change in the long
run.
- Ave
The top graph below shows the marginal cost (MC), average variable cost (AVC), and average total...
 The top graph below shows the marginal cost (MC), average variable cost (AVC), and average total cost (ATC) curves for an individual firm in a competitive commercial ridesharing market where the price has stabilized. In the blank graph below it, use the straight-line tool to draw the long-run market supply curve as a line from one edge of the graph to the other.
Consider the competitive market for halogen lamps. The following graph shows the marginal cost (MC), average total cost (ATC), and average variable cost (AVC) curves for a typical firm in the industry.
 Consider the competitive market for halogen lamps. The following graph shows the marginal cost (MC), average total cost (ATC), and average variable cost (AVC) curves for a typical firm in the industry. For each price in the following table, use the graph to determine the number of lamps this firm would produce in order to maximize its profit. Assume that when the price is exactly equal to the average variable cost, the firm is indifferent between producing zero lamps and the...
P ATC Ave C2 In the graph above, MC is the firm's marginal cost curve, ATC...
 P ATC Ave C2 In the graph above, MC is the firm's marginal cost curve, ATC is the firm's average total cost curve, and AVC is the firm's average variable cost curve. If the equilibrium price in this market is above P2, then firms will enter this market in the long run. firms will exit this market in the long run. the number of firms in this market will not change in the long run.
The curves show the marginal cost (MC), average variable cost (AVC) and average total cost (ATC)...
 The curves show the marginal cost (MC), average variable cost (AVC) and average total cost (ATC) curves for a firm that sell mid-range cars in a competitive market. Use the area tool to draw the area representing the firms profit or loss, if the firm produce 6000 cars. Your answer should be a rectangle drawn with four corners
When the firm produce 6000 cars it earn a profit or suffer a loss of ----- million
The curves show the marginal cost (MC), average variable cost (AVC) and average total cost (ATC) curves for a firm that sell mid-range cars in a competitive market. Use the area tool to draw the area representing the firms profit or loss, if the firm produce 6000 cars. Your answer should be a rectangle drawn with four corners
When the firm produce 6000 cars it earn a profit or suffer a loss of ----- million
 P M C ATC Av In the graph above, MC is the firm's marginal cost curve, ATC is the firm's average total cost curve, and AVC is the firm's average variable cost curve. If the firm faces a price between P1 and P2: the firm will stay open in both the short run and the long run. the firm will stay open in the short run but close in the long run. the firm will close in both the short...
 In the graph above, MC is the firm's marginal cost curve, ATC is
the firm's average total cost curve, and AVC is the firm's average
variable cost curve. If the firm faces a price between P1 and
P2:
the firm will stay open in both the short run and the long
run.
the firm will stay open in the short run but close in the long
run.
the firm will close in both the short and long run.
- -...
In the graph above, MC is the firm's marginal cost curve, ATC is
the firm's average total cost curve, and AVC is the firm's average
variable cost curve. If the firm faces a price between P1 and
P2:
the firm will stay open in both the short run and the long
run.
the firm will stay open in the short run but close in the long
run.
the firm will close in both the short and long run.
- -...
 In the graph above, MC is the firm's marginal cost curve, ATC is
the firm's average total cost curve, and AVC is the firm's average
variable cost curve. If the firm faces a price greater than P2,
then
the firm will stay open in both the short and the long run.
the firm will stay open in the short run, but close in the long
run.
the firm will close in both the short and the long run.
Ате 12...
In the graph above, MC is the firm's marginal cost curve, ATC is
the firm's average total cost curve, and AVC is the firm's average
variable cost curve. If the firm faces a price greater than P2,
then
the firm will stay open in both the short and the long run.
the firm will stay open in the short run, but close in the long
run.
the firm will close in both the short and the long run.
Ате 12...
 12.00 Lauren grows grapes. Her average variable cost (AVC), average total cost (ATC), and marginal cost (MC) of production are illustrated in the figure to the right. 11.00 Assume the market for grapes is perfectly competitive and that the market price is $2.00 per crate. MC Characterize Lauren's economic profits. Assume she produces such that she maximizes profits in the short run. ATC Using the rectangle drawing tool, shade in Lauren's economic profits. Attach the correct label to indicate whether...
 In the graph above, MC is the firm's marginal cost curve, ATC is
the firm's average total cost curve, and AVC is the firm's average
variable cost curve. If the equilibrium price in this market is
above P2, then
firms will exit this market in the long run.
firms will enter this market in the long run.
the number of firms in this market will not change in the long
run.
- Ave
In the graph above, MC is the firm's marginal cost curve, ATC is
the firm's average total cost curve, and AVC is the firm's average
variable cost curve. If the equilibrium price in this market is
above P2, then
firms will exit this market in the long run.
firms will enter this market in the long run.
the number of firms in this market will not change in the long
run.
- Ave
 The top graph below shows the marginal cost (MC), average variable cost (AVC), and average total cost (ATC) curves for an individual firm in a competitive commercial ridesharing market where the price has stabilized. In the blank graph below it, use the straight-line tool to draw the long-run market supply curve as a line from one edge of the graph to the other.
 P ATC Ave C2 In the graph above, MC is the firm's marginal cost curve, ATC is the firm's average total cost curve, and AVC is the firm's average variable cost curve. If the equilibrium price in this market is above P2, then firms will enter this market in the long run. firms will exit this market in the long run. the number of firms in this market will not change in the long run.
 The curves show the marginal cost (MC), average variable cost (AVC) and average total cost (ATC) curves for a firm that sell mid-range cars in a competitive market. Use the area tool to draw the area representing the firms profit or loss, if the firm produce 6000 cars. Your answer should be a rectangle drawn with four corners
When the firm produce 6000 cars it earn a profit or suffer a loss of ----- million
The curves show the marginal cost (MC), average variable cost (AVC) and average total cost (ATC) curves for a firm that sell mid-range cars in a competitive market. Use the area tool to draw the area representing the firms profit or loss, if the firm produce 6000 cars. Your answer should be a rectangle drawn with four corners
When the firm produce 6000 cars it earn a profit or suffer a loss of ----- million
Most questions answered within 3 hours.
-
The extent to which assets are financed by borrowed funds and
other liabilities is indicated by:...
asked 2 minutes ago -
Explain in detail
Germany is the fifth largest economy
explain what goods and services Germany specializes...
asked 17 minutes ago -
The density of platinum is 21.45 g/mL. If a cube of platinum
with a mass of...
asked 22 minutes ago -
Accounts Receivable
Sales
A/R Posting
Extended Sales Invoice
Packing Slip
Compare invoice to packing slip 2...
asked 25 minutes ago -
Michaella, age 23, is a full-time law student and is claimed by
her parents as a...
asked 25 minutes ago -
Why are polymers not typically casted into products?
asked 42 minutes ago -
When rolling a die 129 times, what is the probability of rolling
a 6 no more...
asked 59 minutes ago -
4. A call option currently sells for $7.75. It has a strike
price of $85 and...
asked 48 minutes ago -
1.
You need to prepare 10.0 liters of an acid aqueous solution with a
pH of...
asked 51 minutes ago -
Along an aggregate supply curve, if the level of output is less
than the natural level...
asked 51 minutes ago -
By 2025, annual consumption in emerging markets will total $30
trillion and contribute more than ________...
asked 56 minutes ago -
At what point does reformation cease to be a viable option for
those who are oppressed...
asked 1 hour ago