what are the answers to these questions?
Homework Answers
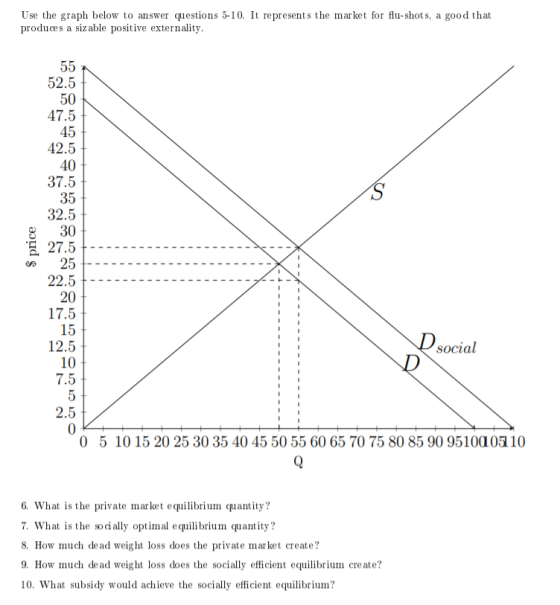
6) private market equilibrium quantity = 50
7) social optimal equilibrium quantity = 55
8) DWL at the private market = 0.5*(55-50)*(30-25) = 12.5
9) DWL = 0 at the socially efficient equilibrium
10) Subsidy = $5
Add Answer to:
what are the answers to these questions?
Use the graph below to answer questions 5-10. It...
55 52.5 50 47.5 45 42.5 Stay 40 37.5 $ price A 32.5 30 27.5 25...
 55 52.5 50 47.5 45 42.5 Stay 40 37.5 $ price A 32.5 30 27.5 25 22.5 20 17.5 15 12.5 10 7.5 2.5 0 5 10 15 20 25 30 35 40 45 50 55 60 65 70 75 80 85 90 951000510 In the above graph, a $5 per unit tax is charged to suppliers. i. locate the after-tax price paid by consumers (P) ii. locate the after-tax price received by producers (P) iii. locate the after-tax quantity...
what are the answers to these questions? Use the graph below to answer que stions 1-5....
 what are the answers to these questions?
Use the graph below to answer que stions 1-5. It represents the market for the monthly U.S. beer market, a delicious product which nonetheless produces one of the largest negative externalities among popular goods Ssocial Sprivate 10 15 20 25 30 35 4045 50 55 60 65 0 5 Qin millions 1. What is the implied amount of the marginal damage in the above graph? 2. At what price is the socially optimal...
what are the answers to these questions?
Use the graph below to answer que stions 1-5. It represents the market for the monthly U.S. beer market, a delicious product which nonetheless produces one of the largest negative externalities among popular goods Ssocial Sprivate 10 15 20 25 30 35 4045 50 55 60 65 0 5 Qin millions 1. What is the implied amount of the marginal damage in the above graph? 2. At what price is the socially optimal...
what are the answers to these questions? Use the graph below to answer questions 11-15. It...
 what are the answers to these questions?
Use the graph below to answer questions 11-15. It represents the US corn market, and market that receives a tremendous amount of subsidization. Ssubsidy $ price per bushel of corn concordia INCOACID-100 0 1 2 3 4 5 6 7 8 910111213141516171819202122232425262728293031 Q in billions 11. What is the implied subsidy in the corn market? 12. What is the after-subsidy price seen by producers? 13. What is the after-subsidy price seen by consumers?...
what are the answers to these questions?
Use the graph below to answer questions 11-15. It represents the US corn market, and market that receives a tremendous amount of subsidization. Ssubsidy $ price per bushel of corn concordia INCOACID-100 0 1 2 3 4 5 6 7 8 910111213141516171819202122232425262728293031 Q in billions 11. What is the implied subsidy in the corn market? 12. What is the after-subsidy price seen by producers? 13. What is the after-subsidy price seen by consumers?...
5) (28 points) Suppose the demand and supply for flu shots are given by pd =...
 5) (28 points) Suppose the demand and supply for flu shots are given by pd = 1200-Q ps = 440 + Q Suppose flu shots generate a positive externality, and the marginal external benefit (MEB) is MEB=60 -0.050. (a) Derive the marginal social benefit (MSB) curve. (b) Draw the Demand, Supply, and MSB curves on the same graph (with P on the vertical axis and Q on the horizontal axis) and clearly indicate the curves in your graph. (c) Calculate...
The graph below shows a market for house-painting services. Use it to answer the questions that...
 The graph below shows a market for house-painting
services. Use it to answer the questions that follow.
A)Painting the exterior of your house yields external
benefits for your neighbors. Label the private benefit and social
benefit curves and show the amount of the external
benefit.
B)What is the equilibrium price and
quantity?
C)What is the socially optimal quantity in this
market?
(d) Does the market produce too much or too little of
this good relative to the socially optimal outcome?...
The graph below shows a market for house-painting
services. Use it to answer the questions that follow.
A)Painting the exterior of your house yields external
benefits for your neighbors. Label the private benefit and social
benefit curves and show the amount of the external
benefit.
B)What is the equilibrium price and
quantity?
C)What is the socially optimal quantity in this
market?
(d) Does the market produce too much or too little of
this good relative to the socially optimal outcome?...
(4) The graph below shows a market for house-painting services. Use it to answer the questions...
 (4) The graph below shows a market for house-painting services. Use it to answer the questions that follow. Price of house painting Supply $2.200 $1,800 $1,600 Demand 110 140 Quantity of houses painted (in thousands) (a) Painting the exterior of your house yields external benefits for your neighbors. Label the private benefit and social benefit curves and show the amount of the external benefit. (b) What is the equilibrium price and quantity? c) What is the socially optimal quantity in...
Please show all steps clearly (a) Suppose there is a price increase to $16. How much...
 Please show all steps clearly
(a)
Suppose there is a price increase to $16. How much is total
consumer surplus in this market at the new price?
(b)
(c)
Suppose there is a price increase to $25. How much is total
producer surplus in this market at the new price?
(d)
Suppose there is a price decrease to $20. What would be the
amount of the dead weight loss in this market at the new price?
(e)
Suppose that demand...
Please show all steps clearly
(a)
Suppose there is a price increase to $16. How much is total
consumer surplus in this market at the new price?
(b)
(c)
Suppose there is a price increase to $25. How much is total
producer surplus in this market at the new price?
(d)
Suppose there is a price decrease to $20. What would be the
amount of the dead weight loss in this market at the new price?
(e)
Suppose that demand...
IMPORTANT: I know that I have a problem walkthrough and answers below, but there's a lot...
 IMPORTANT: I know that I have a problem walkthrough and answers
below, but there's a lot I don't get. Please help me with
this.
a) 1. I see how they got the price elasticity of demand
and how they got the equilibrium price AND quantity. However, I
don't see how they got the elasticity of demand AT the equilibrium
and quantity. Am I looking too much at the word usage or does the
"AND" and "AT" make a difference? If...
IMPORTANT: I know that I have a problem walkthrough and answers
below, but there's a lot I don't get. Please help me with
this.
a) 1. I see how they got the price elasticity of demand
and how they got the equilibrium price AND quantity. However, I
don't see how they got the elasticity of demand AT the equilibrium
and quantity. Am I looking too much at the word usage or does the
"AND" and "AT" make a difference? If...
Use the supply and demand schedule below to answer the following questions: Price Quantity Demand Quantity...
Use the supply and demand schedule below to answer the following questions: Price Quantity Demand Quantity Supplied $15 80 40 25 70 50 35 60 60 45 50 70 55 40 80 a. What is the market equilibrium price and quantity? b. If there is a shortage of 20 units, what is the market price? c. c. At a price of $45, the market experiences a surplus of how many units?
10. Use the graph below to answer the following questions. Dr is the transactions demand for...
 10. Use the graph below to answer the following questions. Dr is the transactions demand for money, Dm is the total demand for money, and Sm is the supply of money Ss Sm2 St Dm D, 325 250 175 125 Quantity of money (a) What is the transactions demand for money in this market? (b) What is the asset demand for money if the interest rate is 4%? (c) If the money market is in equilibrium at 6%, describe the...
 55 52.5 50 47.5 45 42.5 Stay 40 37.5 $ price A 32.5 30 27.5 25 22.5 20 17.5 15 12.5 10 7.5 2.5 0 5 10 15 20 25 30 35 40 45 50 55 60 65 70 75 80 85 90 951000510 In the above graph, a $5 per unit tax is charged to suppliers. i. locate the after-tax price paid by consumers (P) ii. locate the after-tax price received by producers (P) iii. locate the after-tax quantity...
 what are the answers to these questions?
Use the graph below to answer que stions 1-5. It represents the market for the monthly U.S. beer market, a delicious product which nonetheless produces one of the largest negative externalities among popular goods Ssocial Sprivate 10 15 20 25 30 35 4045 50 55 60 65 0 5 Qin millions 1. What is the implied amount of the marginal damage in the above graph? 2. At what price is the socially optimal...
what are the answers to these questions?
Use the graph below to answer que stions 1-5. It represents the market for the monthly U.S. beer market, a delicious product which nonetheless produces one of the largest negative externalities among popular goods Ssocial Sprivate 10 15 20 25 30 35 4045 50 55 60 65 0 5 Qin millions 1. What is the implied amount of the marginal damage in the above graph? 2. At what price is the socially optimal...
 what are the answers to these questions?
Use the graph below to answer questions 11-15. It represents the US corn market, and market that receives a tremendous amount of subsidization. Ssubsidy $ price per bushel of corn concordia INCOACID-100 0 1 2 3 4 5 6 7 8 910111213141516171819202122232425262728293031 Q in billions 11. What is the implied subsidy in the corn market? 12. What is the after-subsidy price seen by producers? 13. What is the after-subsidy price seen by consumers?...
what are the answers to these questions?
Use the graph below to answer questions 11-15. It represents the US corn market, and market that receives a tremendous amount of subsidization. Ssubsidy $ price per bushel of corn concordia INCOACID-100 0 1 2 3 4 5 6 7 8 910111213141516171819202122232425262728293031 Q in billions 11. What is the implied subsidy in the corn market? 12. What is the after-subsidy price seen by producers? 13. What is the after-subsidy price seen by consumers?...
 5) (28 points) Suppose the demand and supply for flu shots are given by pd = 1200-Q ps = 440 + Q Suppose flu shots generate a positive externality, and the marginal external benefit (MEB) is MEB=60 -0.050. (a) Derive the marginal social benefit (MSB) curve. (b) Draw the Demand, Supply, and MSB curves on the same graph (with P on the vertical axis and Q on the horizontal axis) and clearly indicate the curves in your graph. (c) Calculate...
 The graph below shows a market for house-painting
services. Use it to answer the questions that follow.
A)Painting the exterior of your house yields external
benefits for your neighbors. Label the private benefit and social
benefit curves and show the amount of the external
benefit.
B)What is the equilibrium price and
quantity?
C)What is the socially optimal quantity in this
market?
(d) Does the market produce too much or too little of
this good relative to the socially optimal outcome?...
The graph below shows a market for house-painting
services. Use it to answer the questions that follow.
A)Painting the exterior of your house yields external
benefits for your neighbors. Label the private benefit and social
benefit curves and show the amount of the external
benefit.
B)What is the equilibrium price and
quantity?
C)What is the socially optimal quantity in this
market?
(d) Does the market produce too much or too little of
this good relative to the socially optimal outcome?...
 (4) The graph below shows a market for house-painting services. Use it to answer the questions that follow. Price of house painting Supply $2.200 $1,800 $1,600 Demand 110 140 Quantity of houses painted (in thousands) (a) Painting the exterior of your house yields external benefits for your neighbors. Label the private benefit and social benefit curves and show the amount of the external benefit. (b) What is the equilibrium price and quantity? c) What is the socially optimal quantity in...
 Please show all steps clearly
(a)
Suppose there is a price increase to $16. How much is total
consumer surplus in this market at the new price?
(b)
(c)
Suppose there is a price increase to $25. How much is total
producer surplus in this market at the new price?
(d)
Suppose there is a price decrease to $20. What would be the
amount of the dead weight loss in this market at the new price?
(e)
Suppose that demand...
Please show all steps clearly
(a)
Suppose there is a price increase to $16. How much is total
consumer surplus in this market at the new price?
(b)
(c)
Suppose there is a price increase to $25. How much is total
producer surplus in this market at the new price?
(d)
Suppose there is a price decrease to $20. What would be the
amount of the dead weight loss in this market at the new price?
(e)
Suppose that demand...
 IMPORTANT: I know that I have a problem walkthrough and answers
below, but there's a lot I don't get. Please help me with
this.
a) 1. I see how they got the price elasticity of demand
and how they got the equilibrium price AND quantity. However, I
don't see how they got the elasticity of demand AT the equilibrium
and quantity. Am I looking too much at the word usage or does the
"AND" and "AT" make a difference? If...
IMPORTANT: I know that I have a problem walkthrough and answers
below, but there's a lot I don't get. Please help me with
this.
a) 1. I see how they got the price elasticity of demand
and how they got the equilibrium price AND quantity. However, I
don't see how they got the elasticity of demand AT the equilibrium
and quantity. Am I looking too much at the word usage or does the
"AND" and "AT" make a difference? If...
 10. Use the graph below to answer the following questions. Dr is the transactions demand for money, Dm is the total demand for money, and Sm is the supply of money Ss Sm2 St Dm D, 325 250 175 125 Quantity of money (a) What is the transactions demand for money in this market? (b) What is the asset demand for money if the interest rate is 4%? (c) If the money market is in equilibrium at 6%, describe the...
Most questions answered within 3 hours.
-
1.which of the following is a phototroph?
a. sulfolobus
b. chloroflexus
c. bacteroidetes
d. deinococcus radioduran...
asked 2 minutes ago -
The group of companies LC "High-precision measuring instruments"
is the global provider of measurement, analysis and...
asked 8 minutes ago -
I want to write a python function to find the minimum
I have an nested list:...
asked 8 minutes ago -
calculate the number of molecules of gas in a
container of 2.0 liter at 30 degrees...
asked 6 minutes ago -
Convert the high level language programming statementts to 80x86
assembly, Assume X=AX and y=BX
for (i=1;...
asked 17 minutes ago -
SoleMate’s Burkins sneakers cost $40 per pair from the supplier
and are sold by SoleMate at...
asked 21 minutes ago -
The movie Moneyball (based on the book by Michael
Lewis) tells the story of Billy Beane,...
asked 20 minutes ago -
A regional highway uses 8 tollbooths that are open to all
vehicles. A chi-square goodness-of-fit test...
asked 24 minutes ago -
In her Semiannual Monetary Policy Report to Congress on July 13,
2017, then Federal Reserve Chair...
asked 23 minutes ago -
Suppose N packets are sent,
and each packet arrives at rate of L/2R to a link....
asked 42 minutes ago -
17. Show the steps involved in reduction of the ketone in fatty
acid synthesis. Which cofactor...
asked 43 minutes ago -
5.61 g of octane, C8H18, reacts with excess oxygen in a bomb
calorimeter. The heat capacity...
asked 47 minutes ago