z .09 .08 .07
.06 .05 .04 .03
.02 .01 .00 z
-3.4 0.0002 0.0003
0.0003 0.0003 0.0003
0.0003 0.0003 0.0003
0.0003 0.0003 -3.4
-3.3 0.0003 0.0004
0.0004 0.0004 0.0004
0.0004 0.0004 0.0005
0.0005 0.0005 -3.3
-3.2 0.0005 0.0005
0.0005 0.0006 0.0006
0.0006 0.0006 0.0006
0.0007 0.0007 -3.2
-3.1 0.0007 0.0007
0.0008 0.0008 0.0008
0.0008 0.0009 0.0009
0.0009 0.0010 -3.1
-3.0 0.0010 0.0010
0.0011 0.0011 0.0011
0.0012 0.0012 0.0013
0.0013 0.0013 -3.0
-2.9 0.0014 0.0014
0.0015 0.0015 0.0016
0.0016 0.0017 0.0018
0.0018 0.0019 -2.9
-2.8 0.0019 0.0020
0.0021 0.0021 0.0022
0.0023 0.0023 0.0024
0.0025 0.0026 -2.8
-2.7 0.0026 0.0027
0.0028 0.0029 0.0030
0.0031 0.0032 0.0033
0.0034 0.0035 -2.7
-2.6 0.0036 0.0037
0.0038 0.0039 0.0040
0.0041 0.0043 0.0044
0.0045 0.0047 -2.6
-2.5 0.0048 0.0049
0.0051 0.0052 0.0054
0.0055 0.0057 0.0059
0.0060 0.0062 -2.5
-2.4 0.0064 0.0066
0.0068 0.0069 0.0071
0.0073 0.0075 0.0078
0.0080 0.0082 -2.4
-2.3 0.0084 0.0087
0.0089 0.0091 0.0094
0.0096 0.0099 0.0102
0.0104 0.0107 -2.3
-2.2 0.0110 0.0113
0.0116 0.0119 0.0122
0.0125 0.0129 0.0132
0.0136 0.0139 -2.2
-2.1 0.0143 0.0146
0.0150 0.0154 0.0158
0.0162 0.0166 0.0170
0.0174 0.0179 -2.1
-2.0 0.0183 0.0188
0.0192 0.0197 0.0202
0.0207 0.0212 0.0217
0.0222 0.0228 -2.0
-1.9 0.0233 0.0239
0.0244 0.0250 0.0256
0.0262 0.0268 0.0274
0.0281 0.0287 -1.9
-1.8 0.0294 0.0301
0.0307 0.0314 0.0322
0.0329 0.0336 0.0344
0.0351 0.0359 -1.8
-1.7 0.0367 0.0375
0.0384 0.0392 0.0401
0.0409 0.0418 0.0427
0.0436 0.0446 -1.7
-1.6 0.0455 0.0465
0.0475 0.0485 0.0495
0.0505 0.0516 0.0526
0.0537 0.0548 -1.6
-1.5 0.0559 0.0571
0.0582 0.0594 0.0606
0.0618 0.0630 0.0643
0.0655 0.0668 -1.5
-1.4 0.0681 0.0694
0.0708 0.0721 0.0735
0.0749 0.0764 0.0778
0.0793 0.0808 -1.4
-1.3 0.0823 0.0838
0.0853 0.0869 0.0885
0.0901 0.0918 0.0934
0.0951 0.0968 -1.3
-1.2 0.0985 0.1003
0.1020 0.1038 0.1056
0.1075 0.1093 0.1112
0.1131 0.1151 -1.2
-1.1 0.1170 0.1190
0.1210 0.1230 0.1251
0.1271 0.1292 0.1314
0.1335 0.1357 -1.1
-1.0 0.1379 0.1401
0.1423 0.1446 0.1469
0.1492 0.1515 0.1539
0.1562 0.1587 -1.0
-0.9 0.1611 0.1635
0.1660 0.1685 0.1711
0.1736 0.1762 0.1788
0.1814 0.1841 -0.9
-0.8 0.1867 0.1894
0.1922 0.1949 0.1977
0.2005 0.2033 0.2061
0.2090 0.2119 -0.8
-0.7 0.2148 0.2177
0.2206 0.2236 0.2266
0.2296 0.2327 0.2358
0.2389 0.2420 -0.7
-0.6 0.2451 0.2483
0.2514 0.2546 0.2578
0.2611 0.2643 0.2676
0.2709 0.2743 -0.6
-0.5 0.2776 0.2810
0.2843 0.2877 0.2912
0.2946 0.2981 0.3015
0.3050 0.3085 -0.5
-0.4 0.3121 0.3156
0.3192 0.3228 0.3264
0.3300 0.3336 0.3372
0.3409 0.3446 -0.4
-0.3 0.3483 0.3520
0.3557 0.3594 0.3632
0.3669 0.3707 0.3745
0.3783 0.3821 -0.3
-0.2 0.3859 0.3897
0.3936 0.3974 0.4013
0.4052 0.4090 0.4129
0.4168 0.4207 -0.2
-0.1 0.4247 0.4286
0.4325 0.4364 0.4404
0.4443 0.4483 0.4522
0.4562 0.4602 -0.1
-0.0 0.4641 0.4681
0.4721 0.4761 0.4801
0.4840 0.4880 0.4920
0.4960 0.5000 -0.0
z .09 .08 .07
.06 .05 .04 .03
.02 .01 .00
Homework Answers
Solution
Back-up Theory
Symmetry Property of Standard Normal Distribution
P(Z ≤ - t) = P(Z ≥ t) …………………………………………………………………………. (1)
Now to work out the solution,
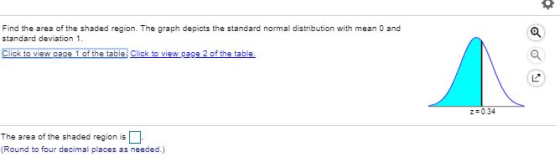
The area of the shaded region in the graph represents the P(Z ≤ 0.34).
Now, from the given table, P(Z < - 0.34) = 0.3669 [Note: The increment in Z given at the top is in descending order and so the above probability is read against – 0.3 in the first column (or last column) and .04 in the 5th column from the right ]
So, vide (1), P(Z ≥ 0.34) = 0.3669
=> P(Z ≤ 0.34) = 1 – 0.3669
= 0.6332 Answer
DONE
[Going beyond, the required probability can be directly obtained using sing Excel Function: Statistical NORMSDIST]
Add Answer to:
z .09 .08 .07
.06 .05 .04 .03
.02 .01 .00 z
-3.4 0.0002 0.0003
0.0003 ...
VI HW Score: 23.53%, 4 of 17 pts 25.3.9 Question Help se the standard normal table...
 VI HW Score: 23.53%, 4 of 17 pts 25.3.9 Question Help se the standard normal table to find the 2-score that corresponds to the given percentile. If the area is not in the table, use the entry closest to the area. If the area is hallway between two entries, use the score halay between the corresponding 2-cores. If convenient, use technology to find the score P20 Click to view page 1 of the title Click to view. 2 of the...
Problem 7 Question Help * David Polston prints up T-shirts to be sold at local concerts....
 Problem 7 Question Help * David Polston prints up T-shirts to be sold at local concerts. The T-shirts sell for $24.20 each but cost David only $8.90 each. However, because the T-shirts have concert-specific information on them, David can sell a leftover shirt for only $1.00. Suppose the demand for shirts can be approximated with a normal distribution and the mean demand is 380 shirts, with a standard deviation of 65. Click the icon to view the normal probability table...
Suppose a random sample of size 15 is taken from a normal population with mean 25...
 Suppose a random sample of size 15 is taken from a normal population with mean 25 and standard deviation 5; and a second, independent random sample of size 21 is taken from a normal population with mean 10 and standard deviation 4. Find the probability P(X- X2 2 17). (Use Appendix Table 3. Give your answer to four decimal places.) p(7. - 12 2 17) = 1.282 Incorrect Table In Standard Normal Distribution Cumulative Probabilities Let 2 be a standard...
these two questions im having trouble on. Provides the tables for both M 6.2.75 се Use...
 these two questions im having trouble on. Provides the tables
for both
M 6.2.75 се Use a standard normal distribution table to obtain the Z-score that has an area of 0.975 to its right. Click here to view page 1 of the normal distribution table, As Click here to view page 2 of the normal distribution table. Za St (Round to two decimal places as needed.) normal distribution page 1 Areas under the standard normal curve Second decimal place in...
these two questions im having trouble on. Provides the tables
for both
M 6.2.75 се Use a standard normal distribution table to obtain the Z-score that has an area of 0.975 to its right. Click here to view page 1 of the normal distribution table, As Click here to view page 2 of the normal distribution table. Za St (Round to two decimal places as needed.) normal distribution page 1 Areas under the standard normal curve Second decimal place in...
please help me answer this, thank you! In an advertising campaign, a snack company claimed that...
 please help me answer this, thank you!
In an advertising campaign, a snack company claimed that every 18-ounce bag of its cookies contained at least 1000 chocolate chips. Two statisticians attempted to verify the claim. The accompanying data represent the number of chips in an 18 ounce bag of the company's cookies based on their study. Complete parts through (e) Click here to view the chocolate chip data table Click here to view the standard normal distribution table (page 1)....
please help me answer this, thank you!
In an advertising campaign, a snack company claimed that every 18-ounce bag of its cookies contained at least 1000 chocolate chips. Two statisticians attempted to verify the claim. The accompanying data represent the number of chips in an 18 ounce bag of the company's cookies based on their study. Complete parts through (e) Click here to view the chocolate chip data table Click here to view the standard normal distribution table (page 1)....
Find the indicated z-scores shown in the graph Click to view page 2 of the table...
 Find the indicated z-scores shown in the graph Click to view page 2 of the table 0.0212 0.0212 The z-scores are (Use a comma to separate answers as needed. Round to two decimal places as needed) We were unable to transcribe this imagei Standard Normal Table (Page 1) z 0.09 0.08 0.07 0.06 0.05 0.04 0.03 0.02 0.01 0.00 -3.4 0.0002 0.0003 0.0003 0.0003 0.0003 0.0003 0.0003 0.0003 0.0003 0.0003 -3.3 0.0003 0.0004 0.0004 0.0004 0.0004 0.0004 00004 0.0005 0.0005...
A television sports commentator wants to estimate the proportion of citizens who follow professional football." Complete...
 A television sports commentator wants to estimate the proportion of citizens who follow professional football." Complete parts (a) through (c). Click here to view the standard normal distribution table (page 1) Click here to view the standard normal distribution table (page 2). (a) What sample size should be obtained if he wants to be within 4 percentage points with 95% confidence if he uses an estimate of 54% obtained from a poll? The sample size is (Round up to the...
A survey of 2317 adults in a certain large country aged 18 and older conducted by...
 A survey of 2317 adults in a certain large country aged 18 and older conducted by a reputable polling organization found that 401 have donated blood in the past two years. Complete parts (a) through (c) below. Click here to view the standard normal distribution table (page 1). Click here to view the standard normal distribution table (page 2). (a) Obtain a point estimate for the population proportion of adults in the country aged 18 and older who have donated...
Question Help Determine the area under the standard normal curve that lies between (a)Z = -0.56...
 Question Help Determine the area under the standard normal curve that lies between (a)Z = -0.56 and Z=0.56, (b) Z=-0.25 and 2 = 0, and (c)Z = -2.25 and Z= -0.93. Click the icon to view a table of areas under the normal curve. (a) The area that lies between 2 -0.56 and Z-0.56 is (Round to four decimal places as needed.) (b) The area that lies between 2 -0.25 and 2.0 is (Round to four decimal places as needed.)...
Question 3 (9 marks) Consider the following information about a non-dividend paying stock: The current stock...
 Question 3 (9 marks) Consider the following information about a non-dividend paying stock: The current stock price is $36, and its return standard deviation is 30% per year. The continuous compound risk-free rate is 3% per year. Assume that the Black-Scholes model correctly prices all the options written on the stock given the information above. a). A call option written on the stock expires in 1 year and has an exercise price of $36. Calculate the Black-Scholes value of the...
 VI HW Score: 23.53%, 4 of 17 pts 25.3.9 Question Help se the standard normal table to find the 2-score that corresponds to the given percentile. If the area is not in the table, use the entry closest to the area. If the area is hallway between two entries, use the score halay between the corresponding 2-cores. If convenient, use technology to find the score P20 Click to view page 1 of the title Click to view. 2 of the...
 Problem 7 Question Help * David Polston prints up T-shirts to be sold at local concerts. The T-shirts sell for $24.20 each but cost David only $8.90 each. However, because the T-shirts have concert-specific information on them, David can sell a leftover shirt for only $1.00. Suppose the demand for shirts can be approximated with a normal distribution and the mean demand is 380 shirts, with a standard deviation of 65. Click the icon to view the normal probability table...
 Suppose a random sample of size 15 is taken from a normal population with mean 25 and standard deviation 5; and a second, independent random sample of size 21 is taken from a normal population with mean 10 and standard deviation 4. Find the probability P(X- X2 2 17). (Use Appendix Table 3. Give your answer to four decimal places.) p(7. - 12 2 17) = 1.282 Incorrect Table In Standard Normal Distribution Cumulative Probabilities Let 2 be a standard...
 these two questions im having trouble on. Provides the tables
for both
M 6.2.75 се Use a standard normal distribution table to obtain the Z-score that has an area of 0.975 to its right. Click here to view page 1 of the normal distribution table, As Click here to view page 2 of the normal distribution table. Za St (Round to two decimal places as needed.) normal distribution page 1 Areas under the standard normal curve Second decimal place in...
these two questions im having trouble on. Provides the tables
for both
M 6.2.75 се Use a standard normal distribution table to obtain the Z-score that has an area of 0.975 to its right. Click here to view page 1 of the normal distribution table, As Click here to view page 2 of the normal distribution table. Za St (Round to two decimal places as needed.) normal distribution page 1 Areas under the standard normal curve Second decimal place in...
 please help me answer this, thank you!
In an advertising campaign, a snack company claimed that every 18-ounce bag of its cookies contained at least 1000 chocolate chips. Two statisticians attempted to verify the claim. The accompanying data represent the number of chips in an 18 ounce bag of the company's cookies based on their study. Complete parts through (e) Click here to view the chocolate chip data table Click here to view the standard normal distribution table (page 1)....
please help me answer this, thank you!
In an advertising campaign, a snack company claimed that every 18-ounce bag of its cookies contained at least 1000 chocolate chips. Two statisticians attempted to verify the claim. The accompanying data represent the number of chips in an 18 ounce bag of the company's cookies based on their study. Complete parts through (e) Click here to view the chocolate chip data table Click here to view the standard normal distribution table (page 1)....
 Find the indicated z-scores shown in the graph Click to view page 2 of the table 0.0212 0.0212 The z-scores are (Use a comma to separate answers as needed. Round to two decimal places as needed) We were unable to transcribe this imagei Standard Normal Table (Page 1) z 0.09 0.08 0.07 0.06 0.05 0.04 0.03 0.02 0.01 0.00 -3.4 0.0002 0.0003 0.0003 0.0003 0.0003 0.0003 0.0003 0.0003 0.0003 0.0003 -3.3 0.0003 0.0004 0.0004 0.0004 0.0004 0.0004 00004 0.0005 0.0005...
 A television sports commentator wants to estimate the proportion of citizens who follow professional football." Complete parts (a) through (c). Click here to view the standard normal distribution table (page 1) Click here to view the standard normal distribution table (page 2). (a) What sample size should be obtained if he wants to be within 4 percentage points with 95% confidence if he uses an estimate of 54% obtained from a poll? The sample size is (Round up to the...
 A survey of 2317 adults in a certain large country aged 18 and older conducted by a reputable polling organization found that 401 have donated blood in the past two years. Complete parts (a) through (c) below. Click here to view the standard normal distribution table (page 1). Click here to view the standard normal distribution table (page 2). (a) Obtain a point estimate for the population proportion of adults in the country aged 18 and older who have donated...
 Question Help Determine the area under the standard normal curve that lies between (a)Z = -0.56 and Z=0.56, (b) Z=-0.25 and 2 = 0, and (c)Z = -2.25 and Z= -0.93. Click the icon to view a table of areas under the normal curve. (a) The area that lies between 2 -0.56 and Z-0.56 is (Round to four decimal places as needed.) (b) The area that lies between 2 -0.25 and 2.0 is (Round to four decimal places as needed.)...
 Question 3 (9 marks) Consider the following information about a non-dividend paying stock: The current stock price is $36, and its return standard deviation is 30% per year. The continuous compound risk-free rate is 3% per year. Assume that the Black-Scholes model correctly prices all the options written on the stock given the information above. a). A call option written on the stock expires in 1 year and has an exercise price of $36. Calculate the Black-Scholes value of the...
Most questions answered within 3 hours.
-
The average length of time between arrivals at a turnpike
toll-booth is 26 seconds. What is...
asked 1 hour ago -
(a) A piston at 6.1 atm contains a gas that occupies a volume of
3.5 L....
asked 2 hours ago -
Please answer true or false. Words
cannot be changed or added in to make it true...
asked 2 hours ago -
An empty test tube weighs 15.923 grams. Then,
MgCl2•6H2O is added into the test tube. After...
asked 2 hours ago -
Assume memory access is 10 units of time and disk access is
10000 units of time....
asked 3 hours ago -
1. Are all good samples random?
2. Magazines often report surveys giving statistics such as “63%...
asked 3 hours ago -
Under all the various types of market structures, firms
must eventually earn some economic profits for...
asked 3 hours ago -
Consider the following fitness regime for a single locus trait
with two co-dominant alleles: w11 =...
asked 3 hours ago -
A large cable company reports the following.
80% of its customers subscribe to its cable TV...
asked 3 hours ago -
Please answer the question in brief.
Discuss the role of ERP in organizations. Are ERP tools...
asked 3 hours ago -
Discuss the pros and cons of collaborative software such
as SameTime. Does it increase productivity? What...
asked 3 hours ago -
Buying your in-laws a gift because it’s expected is
due to the ____________ motive of gift-giving....
asked 3 hours ago