


please help me answer this, thank you!
Homework Answers
(a) Option B: 2nd plot is correct answer.

(b)
The mean of the sample data is 1247.5
The standard deviation of the sample data is 101.2
Calculations:


(c) Option A : 1st graph is correct answer.

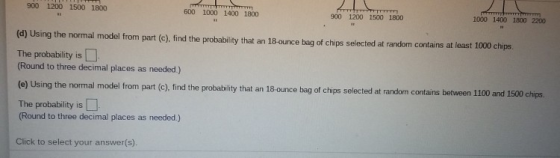
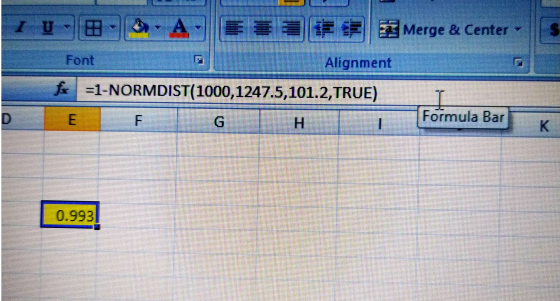
(d) The probability is 0.993
 Using MS-EXCEL:

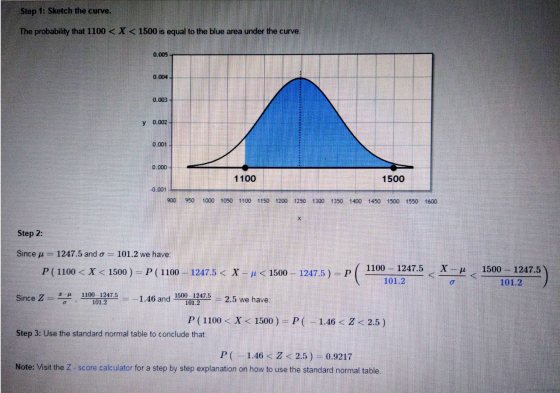
(e)The probability is 0.922
(a) Option B: 2nd plot is correct answer.

(b)
The mean of the sample data is 1247.5
The standard deviation of the sample data is 101.2
Calculations:


(c) Option A : 1st graph is correct answer.

(d) The probability is 0.993
 Using MS-EXCEL:
(e)The probability is 0.922

Add Answer to:
please help me answer this, thank you!
In an advertising campaign, a snack company claimed that...
Problem 7 Question Help * David Polston prints up T-shirts to be sold at local concerts....
 Problem 7 Question Help * David Polston prints up T-shirts to be sold at local concerts. The T-shirts sell for $24.20 each but cost David only $8.90 each. However, because the T-shirts have concert-specific information on them, David can sell a leftover shirt for only $1.00. Suppose the demand for shirts can be approximated with a normal distribution and the mean demand is 380 shirts, with a standard deviation of 65. Click the icon to view the normal probability table...
VI HW Score: 23.53%, 4 of 17 pts 25.3.9 Question Help se the standard normal table...
 VI HW Score: 23.53%, 4 of 17 pts 25.3.9 Question Help se the standard normal table to find the 2-score that corresponds to the given percentile. If the area is not in the table, use the entry closest to the area. If the area is hallway between two entries, use the score halay between the corresponding 2-cores. If convenient, use technology to find the score P20 Click to view page 1 of the title Click to view. 2 of the...
in an advertising campaign, a snack company claimed that every 18-ounce bag if its cookies contained...
 in
an advertising campaign, a snack company claimed that every
18-ounce bag if its cookies contained at least 1000 chocolate
chips.
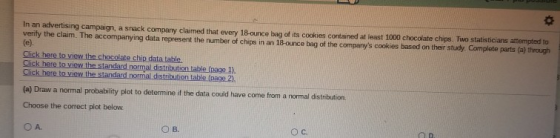
In an advertising campaign, a snack company claimed that every 18-ounce bag of its cookies contained at least 1000 chocolate chips. Two statisticians attempted verify the claim. The accompanying data represent the number of chips in an 18-ounce bag of the company's cookies based on their sludy Complete parts (a) thre Chocolate Chip Data Table from a normal distribution...
in
an advertising campaign, a snack company claimed that every
18-ounce bag if its cookies contained at least 1000 chocolate
chips.
In an advertising campaign, a snack company claimed that every 18-ounce bag of its cookies contained at least 1000 chocolate chips. Two statisticians attempted verify the claim. The accompanying data represent the number of chips in an 18-ounce bag of the company's cookies based on their sludy Complete parts (a) thre Chocolate Chip Data Table from a normal distribution...
Need help with part "D" W 7.3.11 :3 Question Help O In an advertising campaign, a...
 Need help with part "D"
W 7.3.11 :3 Question Help O In an advertising campaign, a snack company claimed that every 18-ounce bag of its cookies contained at least 1000 chocolate chips. Two statisticians attempted to verify the claim. The accompanying data represent the number of chips in an 18-ounce bag of the company's cookies based on their study. Complete parts (a) through (e) Click here to view the chocolate chip data table. Click here to view the standard normal...
Need help with part "D"
W 7.3.11 :3 Question Help O In an advertising campaign, a snack company claimed that every 18-ounce bag of its cookies contained at least 1000 chocolate chips. Two statisticians attempted to verify the claim. The accompanying data represent the number of chips in an 18-ounce bag of the company's cookies based on their study. Complete parts (a) through (e) Click here to view the chocolate chip data table. Click here to view the standard normal...
Suppose a random sample of size 15 is taken from a normal population with mean 25...
 Suppose a random sample of size 15 is taken from a normal population with mean 25 and standard deviation 5; and a second, independent random sample of size 21 is taken from a normal population with mean 10 and standard deviation 4. Find the probability P(X- X2 2 17). (Use Appendix Table 3. Give your answer to four decimal places.) p(7. - 12 2 17) = 1.282 Incorrect Table In Standard Normal Distribution Cumulative Probabilities Let 2 be a standard...
these two questions im having trouble on. Provides the tables for both M 6.2.75 се Use...
 these two questions im having trouble on. Provides the tables
for both
M 6.2.75 се Use a standard normal distribution table to obtain the Z-score that has an area of 0.975 to its right. Click here to view page 1 of the normal distribution table, As Click here to view page 2 of the normal distribution table. Za St (Round to two decimal places as needed.) normal distribution page 1 Areas under the standard normal curve Second decimal place in...
these two questions im having trouble on. Provides the tables
for both
M 6.2.75 се Use a standard normal distribution table to obtain the Z-score that has an area of 0.975 to its right. Click here to view page 1 of the normal distribution table, As Click here to view page 2 of the normal distribution table. Za St (Round to two decimal places as needed.) normal distribution page 1 Areas under the standard normal curve Second decimal place in...
z .09 .08 .07 .06 .05 .04 .03 .02 .01 .00 z -3.4 0.0002 0.0003 0.0003 ...
 z .09 .08 .07
.06 .05 .04 .03
.02 .01 .00 z
-3.4 0.0002 0.0003
0.0003 0.0003 0.0003
0.0003 0.0003 0.0003
0.0003 0.0003 -3.4
-3.3 0.0003 0.0004
0.0004 0.0004 0.0004
0.0004 0.0004 0.0005
0.0005 0.0005 -3.3
-3.2 0.0005 0.0005
0.0005 0.0006 0.0006
0.0006 0.0006 0.0006
0.0007 0.0007 -3.2
-3.1 0.0007 0.0007
0.0008 0.0008 0.0008
0.0008 0.0009 0.0009
0.0009 0.0010 -3.1
-3.0 0.0010 0.0010
0.0011 0.0011 0.0011
0.0012 0.0012 0.0013
0.0013 0.0013 -3.0
-2.9 0.0014 0.0014
0.0015 0.0015 0.0016
0.0016 0.0017 ...
z .09 .08 .07
.06 .05 .04 .03
.02 .01 .00 z
-3.4 0.0002 0.0003
0.0003 0.0003 0.0003
0.0003 0.0003 0.0003
0.0003 0.0003 -3.4
-3.3 0.0003 0.0004
0.0004 0.0004 0.0004
0.0004 0.0004 0.0005
0.0005 0.0005 -3.3
-3.2 0.0005 0.0005
0.0005 0.0006 0.0006
0.0006 0.0006 0.0006
0.0007 0.0007 -3.2
-3.1 0.0007 0.0007
0.0008 0.0008 0.0008
0.0008 0.0009 0.0009
0.0009 0.0010 -3.1
-3.0 0.0010 0.0010
0.0011 0.0011 0.0011
0.0012 0.0012 0.0013
0.0013 0.0013 -3.0
-2.9 0.0014 0.0014
0.0015 0.0015 0.0016
0.0016 0.0017 ...
A television sports commentator wants to estimate the proportion of citizens who follow professional football." Complete...
 A television sports commentator wants to estimate the proportion of citizens who follow professional football." Complete parts (a) through (c). Click here to view the standard normal distribution table (page 1) Click here to view the standard normal distribution table (page 2). (a) What sample size should be obtained if he wants to be within 4 percentage points with 95% confidence if he uses an estimate of 54% obtained from a poll? The sample size is (Round up to the...
Answer the following question. B Putting It Together: Which Procedure Do I Use? X9.3.17 O of 1 Point EQuestion...
 Answer the following question.
B Putting It Together: Which Procedure Do I Use? X9.3.17 O of 1 Point EQuestion Help In a survey of 1015 adults, a polling agency asked, "When you retire, do you think you will have enough money to live comfortably or not. Of the 1015 surveyed, 535 stated that they were worried about having enough money to live comfortably in retirement. Construct a 90% confidence interval for the proportion of adults who are worried about having...
Answer the following question.
B Putting It Together: Which Procedure Do I Use? X9.3.17 O of 1 Point EQuestion Help In a survey of 1015 adults, a polling agency asked, "When you retire, do you think you will have enough money to live comfortably or not. Of the 1015 surveyed, 535 stated that they were worried about having enough money to live comfortably in retirement. Construct a 90% confidence interval for the proportion of adults who are worried about having...
A random sample of 16 undergraduate students receiving student loans was obtained, and the amounts of...
 A random sample of 16 undergraduate students receiving student loans was obtained, and the amounts of their loans for the school year were recorded. Use a normal probability plot to assess whether the sample data could have come from a population that is normally distributed. 5,800 2.000 6,200 1,500 6,800 8,400 5,100 3,000 1,800 7,500 3,300 2,500 1,900 5,600 4,500 7,200 Click here to view the table of critical values Click here to view page 1 of the standard normal...
 Problem 7 Question Help * David Polston prints up T-shirts to be sold at local concerts. The T-shirts sell for $24.20 each but cost David only $8.90 each. However, because the T-shirts have concert-specific information on them, David can sell a leftover shirt for only $1.00. Suppose the demand for shirts can be approximated with a normal distribution and the mean demand is 380 shirts, with a standard deviation of 65. Click the icon to view the normal probability table...
 VI HW Score: 23.53%, 4 of 17 pts 25.3.9 Question Help se the standard normal table to find the 2-score that corresponds to the given percentile. If the area is not in the table, use the entry closest to the area. If the area is hallway between two entries, use the score halay between the corresponding 2-cores. If convenient, use technology to find the score P20 Click to view page 1 of the title Click to view. 2 of the...
 in
an advertising campaign, a snack company claimed that every
18-ounce bag if its cookies contained at least 1000 chocolate
chips.
In an advertising campaign, a snack company claimed that every 18-ounce bag of its cookies contained at least 1000 chocolate chips. Two statisticians attempted verify the claim. The accompanying data represent the number of chips in an 18-ounce bag of the company's cookies based on their sludy Complete parts (a) thre Chocolate Chip Data Table from a normal distribution...
in
an advertising campaign, a snack company claimed that every
18-ounce bag if its cookies contained at least 1000 chocolate
chips.
In an advertising campaign, a snack company claimed that every 18-ounce bag of its cookies contained at least 1000 chocolate chips. Two statisticians attempted verify the claim. The accompanying data represent the number of chips in an 18-ounce bag of the company's cookies based on their sludy Complete parts (a) thre Chocolate Chip Data Table from a normal distribution...
 Need help with part "D"
W 7.3.11 :3 Question Help O In an advertising campaign, a snack company claimed that every 18-ounce bag of its cookies contained at least 1000 chocolate chips. Two statisticians attempted to verify the claim. The accompanying data represent the number of chips in an 18-ounce bag of the company's cookies based on their study. Complete parts (a) through (e) Click here to view the chocolate chip data table. Click here to view the standard normal...
Need help with part "D"
W 7.3.11 :3 Question Help O In an advertising campaign, a snack company claimed that every 18-ounce bag of its cookies contained at least 1000 chocolate chips. Two statisticians attempted to verify the claim. The accompanying data represent the number of chips in an 18-ounce bag of the company's cookies based on their study. Complete parts (a) through (e) Click here to view the chocolate chip data table. Click here to view the standard normal...
 Suppose a random sample of size 15 is taken from a normal population with mean 25 and standard deviation 5; and a second, independent random sample of size 21 is taken from a normal population with mean 10 and standard deviation 4. Find the probability P(X- X2 2 17). (Use Appendix Table 3. Give your answer to four decimal places.) p(7. - 12 2 17) = 1.282 Incorrect Table In Standard Normal Distribution Cumulative Probabilities Let 2 be a standard...
 these two questions im having trouble on. Provides the tables
for both
M 6.2.75 се Use a standard normal distribution table to obtain the Z-score that has an area of 0.975 to its right. Click here to view page 1 of the normal distribution table, As Click here to view page 2 of the normal distribution table. Za St (Round to two decimal places as needed.) normal distribution page 1 Areas under the standard normal curve Second decimal place in...
these two questions im having trouble on. Provides the tables
for both
M 6.2.75 се Use a standard normal distribution table to obtain the Z-score that has an area of 0.975 to its right. Click here to view page 1 of the normal distribution table, As Click here to view page 2 of the normal distribution table. Za St (Round to two decimal places as needed.) normal distribution page 1 Areas under the standard normal curve Second decimal place in...
 z .09 .08 .07
.06 .05 .04 .03
.02 .01 .00 z
-3.4 0.0002 0.0003
0.0003 0.0003 0.0003
0.0003 0.0003 0.0003
0.0003 0.0003 -3.4
-3.3 0.0003 0.0004
0.0004 0.0004 0.0004
0.0004 0.0004 0.0005
0.0005 0.0005 -3.3
-3.2 0.0005 0.0005
0.0005 0.0006 0.0006
0.0006 0.0006 0.0006
0.0007 0.0007 -3.2
-3.1 0.0007 0.0007
0.0008 0.0008 0.0008
0.0008 0.0009 0.0009
0.0009 0.0010 -3.1
-3.0 0.0010 0.0010
0.0011 0.0011 0.0011
0.0012 0.0012 0.0013
0.0013 0.0013 -3.0
-2.9 0.0014 0.0014
0.0015 0.0015 0.0016
0.0016 0.0017 ...
z .09 .08 .07
.06 .05 .04 .03
.02 .01 .00 z
-3.4 0.0002 0.0003
0.0003 0.0003 0.0003
0.0003 0.0003 0.0003
0.0003 0.0003 -3.4
-3.3 0.0003 0.0004
0.0004 0.0004 0.0004
0.0004 0.0004 0.0005
0.0005 0.0005 -3.3
-3.2 0.0005 0.0005
0.0005 0.0006 0.0006
0.0006 0.0006 0.0006
0.0007 0.0007 -3.2
-3.1 0.0007 0.0007
0.0008 0.0008 0.0008
0.0008 0.0009 0.0009
0.0009 0.0010 -3.1
-3.0 0.0010 0.0010
0.0011 0.0011 0.0011
0.0012 0.0012 0.0013
0.0013 0.0013 -3.0
-2.9 0.0014 0.0014
0.0015 0.0015 0.0016
0.0016 0.0017 ...
 A television sports commentator wants to estimate the proportion of citizens who follow professional football." Complete parts (a) through (c). Click here to view the standard normal distribution table (page 1) Click here to view the standard normal distribution table (page 2). (a) What sample size should be obtained if he wants to be within 4 percentage points with 95% confidence if he uses an estimate of 54% obtained from a poll? The sample size is (Round up to the...
 Answer the following question.
B Putting It Together: Which Procedure Do I Use? X9.3.17 O of 1 Point EQuestion Help In a survey of 1015 adults, a polling agency asked, "When you retire, do you think you will have enough money to live comfortably or not. Of the 1015 surveyed, 535 stated that they were worried about having enough money to live comfortably in retirement. Construct a 90% confidence interval for the proportion of adults who are worried about having...
Answer the following question.
B Putting It Together: Which Procedure Do I Use? X9.3.17 O of 1 Point EQuestion Help In a survey of 1015 adults, a polling agency asked, "When you retire, do you think you will have enough money to live comfortably or not. Of the 1015 surveyed, 535 stated that they were worried about having enough money to live comfortably in retirement. Construct a 90% confidence interval for the proportion of adults who are worried about having...
 A random sample of 16 undergraduate students receiving student loans was obtained, and the amounts of their loans for the school year were recorded. Use a normal probability plot to assess whether the sample data could have come from a population that is normally distributed. 5,800 2.000 6,200 1,500 6,800 8,400 5,100 3,000 1,800 7,500 3,300 2,500 1,900 5,600 4,500 7,200 Click here to view the table of critical values Click here to view page 1 of the standard normal...
Most questions answered within 3 hours.
-
You are trying to convince your friend who wants to attend
medical school to take BY123...
asked 6 minutes ago -
Subject: C++
I have created a class called QueueOfIntegers in a file called
QueueOfIntegers.h, which is...
asked 6 minutes ago -
calculate the number of molecules of gas in a
container of 2.0 liter at 30 degrees...
asked 23 minutes ago -
1.which of the following is a phototroph?
a. sulfolobus
b. chloroflexus
c. bacteroidetes
d. deinococcus radioduran...
asked 19 minutes ago -
The group of companies LC "High-precision measuring instruments"
is the global provider of measurement, analysis and...
asked 25 minutes ago -
I want to write a python function to find the minimum
I have an nested list:...
asked 25 minutes ago -
Convert the high level language programming statementts to 80x86
assembly, Assume X=AX and y=BX
for (i=1;...
asked 35 minutes ago -
SoleMate’s Burkins sneakers cost $40 per pair from the supplier
and are sold by SoleMate at...
asked 39 minutes ago -
The movie Moneyball (based on the book by Michael
Lewis) tells the story of Billy Beane,...
asked 38 minutes ago -
A regional highway uses 8 tollbooths that are open to all
vehicles. A chi-square goodness-of-fit test...
asked 41 minutes ago -
In her Semiannual Monetary Policy Report to Congress on July 13,
2017, then Federal Reserve Chair...
asked 40 minutes ago -
Suppose N packets are sent,
and each packet arrives at rate of L/2R to a link....
asked 59 minutes ago