
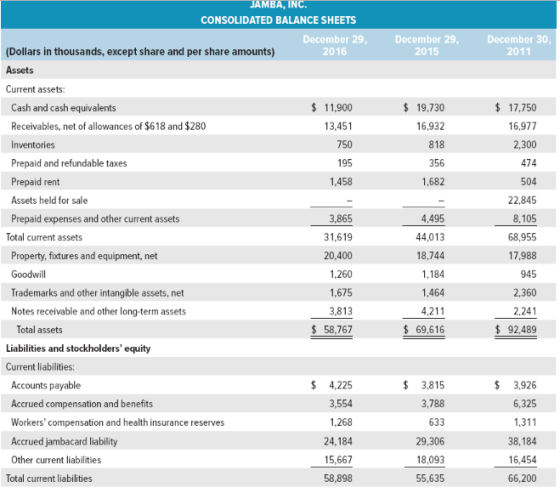
I need help finding the Debt to Equity Ratio. Here are the two balance sheets that were provided. I know that all of my other calculations are correct.

Homework Answers
Solution:
We know that debt to equity ratio is a ratio that is used to indicate the relative proportion of shareholder's equity and company debt which is used to finance company's assets. It is calculated by dividing a company's total liabilities by its shareholder's equity.
Debt to equity ratio = Total Liabilities / Shareholder's Equity
For the respective Years the values are
| Year | Total Liabilities | Shareholder's equity | Debt to Equity Calculations | Solution |
| 2016 | 55997 | 2770 | = 55997 / 2770 = 20.21 | 20.21 |
| 2015 | 64625 | 4991 | = 64625 / 4991 = 12.9483 | 12.95 |
| 2011 | 75744 | 16745 | = 75744 / 16745 = 4.523 | 4.52 |
Add Answer to:
I need help finding the Debt to Equity Ratio. Here are the two
balance sheets that...
Exhibits 1 and 2 in the case provide performance information for Jamba Juice for the years...
 Exhibits 1 and 2 in the case provide performance information for
Jamba Juice for the years 2014 through 2016. For each item listed
below, calculate the rate of annual growth (or decline) from 2014
to 2015 and for 2015 to 2016. All calculations should be rounded to
one decimal (e.g., 12.7%).
I need help finding the operating income %. I know that the
other calculations are correct.
Here are the charts provided to help find these percentages.
2015-2016 (2.26) %...
Exhibits 1 and 2 in the case provide performance information for
Jamba Juice for the years 2014 through 2016. For each item listed
below, calculate the rate of annual growth (or decline) from 2014
to 2015 and for 2015 to 2016. All calculations should be rounded to
one decimal (e.g., 12.7%).
I need help finding the operating income %. I know that the
other calculations are correct.
Here are the charts provided to help find these percentages.
2015-2016 (2.26) %...
Analyze the various operating expenses as percentages of gross profit for Jamba Juice in the last five years. Should Jam...
 Analyze the various operating expenses as percentages of gross
profit for Jamba Juice in the last five years. Should Jamba Juice
try to increase the price of its products? What operating expenses
are hurting Jamba Juice the most? Suggest possible turnaround
actions the company should take.
JAMBA, INC. CONSOLIDATED BALANCE SHEETS December 29, 2016 7,099 55,997 December 29, 2015 8,990 64,625 December 30, 2011 9,544 75.744 (Dollars in thousands, except share and per share amounts) Deterred rent and other long-term...
Analyze the various operating expenses as percentages of gross
profit for Jamba Juice in the last five years. Should Jamba Juice
try to increase the price of its products? What operating expenses
are hurting Jamba Juice the most? Suggest possible turnaround
actions the company should take.
JAMBA, INC. CONSOLIDATED BALANCE SHEETS December 29, 2016 7,099 55,997 December 29, 2015 8,990 64,625 December 30, 2011 9,544 75.744 (Dollars in thousands, except share and per share amounts) Deterred rent and other long-term...
Presented here are summarized data from the balance sheets and income statements of Wiper, Inc.: WIPER,...
Presented here are summarized data from the balance sheets and income statements of Wiper, Inc.: WIPER, INC. Condensed Balance Sheets December 31, 2017, 2016, 2015 (in millions) 2017 2016 2015 Current assets $ 793 $ 1,021 $ 883 Other assets 2,428 1,935 1,734 Total assets $ 3,221 $ 2,956 $ 2,617 Current liabilities $ 592 $ 845 $ 742 Long-term liabilities 1,607 1,070 942 Stockholders’ equity 1,022 1,041 933 Total liabilities and stockholders' equity $ 3,221 $ 2,956 $ 2,617...
Presented here are summarized data from the balance sheets and income statements of Wiper, Inc.: WIPER,...
Presented here are summarized data from the balance sheets and income statements of Wiper, Inc.: WIPER, INC. Condensed Balance Sheets December 31, 2017, 2016, 2015 (in millions) 2017 2016 2015 Current assets $ 707 $ 939 $ 793 Other assets 2,419 1,926 1,725 Total assets $ 3,126 $ 2,865 $ 2,518 Current liabilities $ 583 $ 836 $ 724 Long-term liabilities 1,530 997 870 Stockholders’ equity 1,013 1,032 924 Total liabilities and stockholders' equity $ 3,126 $ 2,865 $ 2,518...
Calculate the Net Working Capital and Current Ratio for Jacobs Engineering Group for 201 JACOBS ENGINEERING...
 Calculate the Net Working Capital and Current Ratio for Jacobs Engineering Group for 201 JACOBS ENGINEERING GROUP INC. AND SUBSIDIARIES CONSOLIDATED BALANCE SHEETS (In thousands, except share information) At September 29, 2017 and September 30, 2016 ASSETS Current Assets 655,716 2,115,663 93,091 864,470 319,673 Cash and cash equivalents 774,151 S 2,102,543 119,486 996,180 349,911 Prepaid expenses and other current assets Total current assets Property, Equipment, and Improvements, net Other Noncurrent Assets Goodwill Intangibles, net Miscellaneons 3,009,826 332,920 692,022 4,034,768 3,079,628...
calculate ROI for 2017 resented here are the comparative balance sheets of Hames, Inc., at December...
 calculate ROI for 2017
resented here are the comparative balance sheets of Hames, Inc., at December 31, 2017 and 2016. Sales fo HAMES, INC., Balance Sheets December 31, 2017 and 2016 2017 2016 $ 20,000 78,000 103,000 $ 201,000 50,000 125,000 (65,000) $ 311,000 $ 21,000 72,000 99,000 $ 192,000 40,000 110,000 (60,000) $ 282,000 Assets Cash Accounts receivable Merchandise inventory Total current assets Land Plant and equipment Less: Accumulated depreciation Total assets Liabilities Short-term debt Accounts payable Other accrued...
calculate ROI for 2017
resented here are the comparative balance sheets of Hames, Inc., at December 31, 2017 and 2016. Sales fo HAMES, INC., Balance Sheets December 31, 2017 and 2016 2017 2016 $ 20,000 78,000 103,000 $ 201,000 50,000 125,000 (65,000) $ 311,000 $ 21,000 72,000 99,000 $ 192,000 40,000 110,000 (60,000) $ 282,000 Assets Cash Accounts receivable Merchandise inventory Total current assets Land Plant and equipment Less: Accumulated depreciation Total assets Liabilities Short-term debt Accounts payable Other accrued...
Presented here are the comparative balance sheets of Hames, Inc., at December 31, 2017 and 2016....
 Presented here are the comparative balance sheets of Hames, Inc., at December 31, 2017 and 2016. Sales for the year ended December 31, 2017, totaled $540,000. HAMES, INC., Balance Sheets December 31, 2017 and 2016 2017 2016 $ 22,000 78,000 103,000 $ 203,000 50,000 125,000 (65,000) $ 313,000 $ 19,000 72,000 99,000 $ 190,000 40,000 110,000 (60,000 $ 280,000 17,000 Assets Cash Accounts receivable Merchandise inventory Total current assets Land Plant and equipment Less: Accumulated depreciation Total assets Liabilities Short-term...
1.value: 5.00 points Presented here are the comparative balance sheets of Hames, Inc., at December 31,...
1.value: 5.00 points Presented here are the comparative balance sheets of Hames, Inc., at December 31, 2017 and 2016. Sales for the year ended December 31, 2017, totaled $670,000. HAMES, INC., Balance Sheets December 31, 2017 and 2016 2017 2016 Assets Cash $ 20,000 $ 21,000 Accounts receivable 78,000 72,000 Merchandise inventory 103,000 99,000 Total current assets $ 201,000 $ 192,000 Land 50,000 40,000 Plant and equipment 125,000 110,000 Less: Accumulated depreciation (65,000 ) (60,000 ) Total assets $ 311,000...
I neeed the dividened yield Presented here are summarized data from the balance sheets and income...
I neeed the dividened yield Presented here are summarized data from the balance sheets and income statements of Wiper Inc.: WIPER INC. Condensed Balance Sheets December 31, 2020, 2019, 2018 (in millions) 2020 2019 2018 Current assets $ 683 $ 915 $ 763 Other assets 2,416 1,923 1,722 Total assets $ 3,099 $ 2,838 $ 2,485 Current liabilities $ 576 $ 806 $ 713 Long-term liabilities 1,513 1,003 851 Stockholders’ equity 1,010 1,029 921 Total liabilities and stockholders' equity $...
Presented here are the comparative balance sheets of Hames, Inc., at December 31, 2017 and 2016....
Presented here are the comparative balance sheets of Hames, Inc., at December 31, 2017 and 2016. Sales for the year ended December 31, 2017, totaled $580,000. HAMES, INC., Balance Sheets December 31, 2017 and 2016 2017 2016 Assets Cash $ 23,000 $ 19,000 Accounts receivable 78,000 72,000 Merchandise inventory 103,000 99,000 Total current assets $ 204,000 $ 190,000 Land 50,000 40,000 Plant and equipment 125,000 110,000 Less: Accumulated depreciation (65,000 ) (60,000 ) Total assets $ 314,000 $ 280,000 Liabilities...
 Exhibits 1 and 2 in the case provide performance information for
Jamba Juice for the years 2014 through 2016. For each item listed
below, calculate the rate of annual growth (or decline) from 2014
to 2015 and for 2015 to 2016. All calculations should be rounded to
one decimal (e.g., 12.7%).
I need help finding the operating income %. I know that the
other calculations are correct.
Here are the charts provided to help find these percentages.
2015-2016 (2.26) %...
Exhibits 1 and 2 in the case provide performance information for
Jamba Juice for the years 2014 through 2016. For each item listed
below, calculate the rate of annual growth (or decline) from 2014
to 2015 and for 2015 to 2016. All calculations should be rounded to
one decimal (e.g., 12.7%).
I need help finding the operating income %. I know that the
other calculations are correct.
Here are the charts provided to help find these percentages.
2015-2016 (2.26) %...
 Analyze the various operating expenses as percentages of gross
profit for Jamba Juice in the last five years. Should Jamba Juice
try to increase the price of its products? What operating expenses
are hurting Jamba Juice the most? Suggest possible turnaround
actions the company should take.
JAMBA, INC. CONSOLIDATED BALANCE SHEETS December 29, 2016 7,099 55,997 December 29, 2015 8,990 64,625 December 30, 2011 9,544 75.744 (Dollars in thousands, except share and per share amounts) Deterred rent and other long-term...
Analyze the various operating expenses as percentages of gross
profit for Jamba Juice in the last five years. Should Jamba Juice
try to increase the price of its products? What operating expenses
are hurting Jamba Juice the most? Suggest possible turnaround
actions the company should take.
JAMBA, INC. CONSOLIDATED BALANCE SHEETS December 29, 2016 7,099 55,997 December 29, 2015 8,990 64,625 December 30, 2011 9,544 75.744 (Dollars in thousands, except share and per share amounts) Deterred rent and other long-term...
 Calculate the Net Working Capital and Current Ratio for Jacobs Engineering Group for 201 JACOBS ENGINEERING GROUP INC. AND SUBSIDIARIES CONSOLIDATED BALANCE SHEETS (In thousands, except share information) At September 29, 2017 and September 30, 2016 ASSETS Current Assets 655,716 2,115,663 93,091 864,470 319,673 Cash and cash equivalents 774,151 S 2,102,543 119,486 996,180 349,911 Prepaid expenses and other current assets Total current assets Property, Equipment, and Improvements, net Other Noncurrent Assets Goodwill Intangibles, net Miscellaneons 3,009,826 332,920 692,022 4,034,768 3,079,628...
 calculate ROI for 2017
resented here are the comparative balance sheets of Hames, Inc., at December 31, 2017 and 2016. Sales fo HAMES, INC., Balance Sheets December 31, 2017 and 2016 2017 2016 $ 20,000 78,000 103,000 $ 201,000 50,000 125,000 (65,000) $ 311,000 $ 21,000 72,000 99,000 $ 192,000 40,000 110,000 (60,000) $ 282,000 Assets Cash Accounts receivable Merchandise inventory Total current assets Land Plant and equipment Less: Accumulated depreciation Total assets Liabilities Short-term debt Accounts payable Other accrued...
calculate ROI for 2017
resented here are the comparative balance sheets of Hames, Inc., at December 31, 2017 and 2016. Sales fo HAMES, INC., Balance Sheets December 31, 2017 and 2016 2017 2016 $ 20,000 78,000 103,000 $ 201,000 50,000 125,000 (65,000) $ 311,000 $ 21,000 72,000 99,000 $ 192,000 40,000 110,000 (60,000) $ 282,000 Assets Cash Accounts receivable Merchandise inventory Total current assets Land Plant and equipment Less: Accumulated depreciation Total assets Liabilities Short-term debt Accounts payable Other accrued...
 Presented here are the comparative balance sheets of Hames, Inc., at December 31, 2017 and 2016. Sales for the year ended December 31, 2017, totaled $540,000. HAMES, INC., Balance Sheets December 31, 2017 and 2016 2017 2016 $ 22,000 78,000 103,000 $ 203,000 50,000 125,000 (65,000) $ 313,000 $ 19,000 72,000 99,000 $ 190,000 40,000 110,000 (60,000 $ 280,000 17,000 Assets Cash Accounts receivable Merchandise inventory Total current assets Land Plant and equipment Less: Accumulated depreciation Total assets Liabilities Short-term...
Most questions answered within 3 hours.
-
Ripples in a pond travel at a velocity of 3 m/s with one peak
passing a...
asked 10 minutes ago -
A man stands on the roof of a building of height 13.0 mm and
throws a...
asked 16 minutes ago -
Based on the range, which of the following sets of scores has
the greatest variability? 3,...
asked 20 minutes ago -
The extent to which assets are financed by borrowed funds and
other liabilities is indicated by:...
asked 1 hour ago -
Explain in detail
Germany is the fifth largest economy
explain what goods and services Germany specializes...
asked 1 hour ago -
The density of platinum is 21.45 g/mL. If a cube of platinum
with a mass of...
asked 1 hour ago -
Accounts Receivable
Sales
A/R Posting
Extended Sales Invoice
Packing Slip
Compare invoice to packing slip 2...
asked 1 hour ago -
Michaella, age 23, is a full-time law student and is claimed by
her parents as a...
asked 1 hour ago -
Why are polymers not typically casted into products?
asked 1 hour ago -
When rolling a die 129 times, what is the probability of rolling
a 6 no more...
asked 2 hours ago -
4. A call option currently sells for $7.75. It has a strike
price of $85 and...
asked 2 hours ago -
1.
You need to prepare 10.0 liters of an acid aqueous solution with a
pH of...
asked 2 hours ago