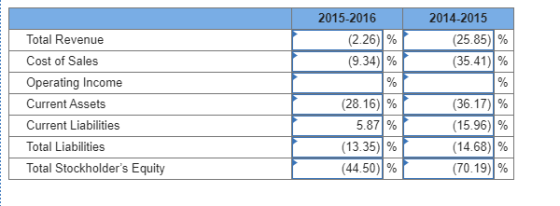
Exhibits 1 and 2 in the case provide performance information for Jamba Juice for the years 2014 through 2016. For each item listed below, calculate the rate of annual growth (or decline) from 2014 to 2015 and for 2015 to 2016. All calculations should be rounded to one decimal (e.g., 12.7%).
I need help finding the operating income %. I know that the other calculations are correct.
Here are the charts provided to help find these percentages.


Homework Answers

Add Answer to:
Exhibits 1 and 2 in the case provide performance information for
Jamba Juice for the years...
Analyze the various operating expenses as percentages of gross profit for Jamba Juice in the last five years. Should Jam...
 Analyze the various operating expenses as percentages of gross
profit for Jamba Juice in the last five years. Should Jamba Juice
try to increase the price of its products? What operating expenses
are hurting Jamba Juice the most? Suggest possible turnaround
actions the company should take.
JAMBA, INC. CONSOLIDATED BALANCE SHEETS December 29, 2016 7,099 55,997 December 29, 2015 8,990 64,625 December 30, 2011 9,544 75.744 (Dollars in thousands, except share and per share amounts) Deterred rent and other long-term...
Analyze the various operating expenses as percentages of gross
profit for Jamba Juice in the last five years. Should Jamba Juice
try to increase the price of its products? What operating expenses
are hurting Jamba Juice the most? Suggest possible turnaround
actions the company should take.
JAMBA, INC. CONSOLIDATED BALANCE SHEETS December 29, 2016 7,099 55,997 December 29, 2015 8,990 64,625 December 30, 2011 9,544 75.744 (Dollars in thousands, except share and per share amounts) Deterred rent and other long-term...
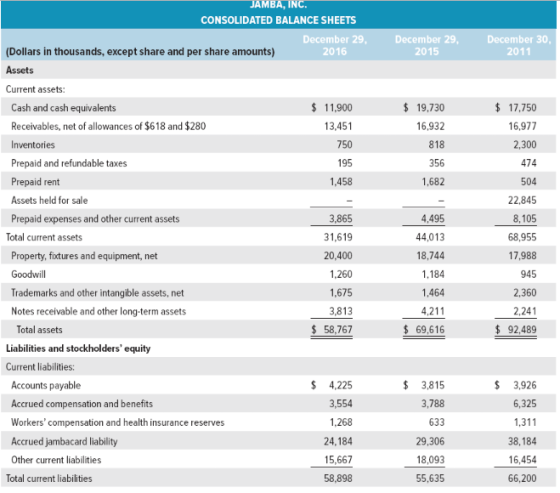
I need help finding the Debt to Equity Ratio. Here are the two balance sheets that...
 I need help finding the Debt to Equity Ratio. Here are the two
balance sheets that were provided. I know that all of my other
calculations are correct.
answers should look like -0.05 or 1.33 2016 2015 2014 1.92 % 6.34 % 1.51 % Operating Income to Revenue 0.54 % 0.79% 1.04 % Current Ratio 0.20 Cash Ratio 0.35 0.27 Debt to Equity JAMBA, INC. CONSOLIDATED BALANCE SHEETS December 29, December 29, December 30, 2011 (Dollars in thousands, except share...
I need help finding the Debt to Equity Ratio. Here are the two
balance sheets that were provided. I know that all of my other
calculations are correct.
answers should look like -0.05 or 1.33 2016 2015 2014 1.92 % 6.34 % 1.51 % Operating Income to Revenue 0.54 % 0.79% 1.04 % Current Ratio 0.20 Cash Ratio 0.35 0.27 Debt to Equity JAMBA, INC. CONSOLIDATED BALANCE SHEETS December 29, December 29, December 30, 2011 (Dollars in thousands, except share...
h. Days of inventory. 1. Inventory turnover ratio. J. Average collection period Based on these ratios,...
 h. Days of inventory. 1. Inventory turnover ratio. J. Average collection period Based on these ratios, did Macy's financial performance improve, weaken, or remain about the same from 2015 to 2016? (479) 198 Consolidated Statements of Income for Macy's, Inc., 2015-2016 (in millions, except per share amounts) 2016 2015 Net sales $25,778 $27,079 Cost of sales (15,621) (16,496 Gross margin 10,157 10,583 Selling, general and administrative expenses (8,265) (8,256) Impairments, store closing and other costs (288) Settlement charges Operating income...
ASSURANCE OF LEARNING EXERCISES 1. conn LO4-1 Using the financial ratios provided in the Appendix and...
 ASSURANCE OF LEARNING EXERCISES 1. conn LO4-1 Using the financial ratios provided in the Appendix and the following financial statement information for Macy's, Inc., calculate the following ratios for Macy's for both 2015 and 2016. 1. Gross profit margin 2. Operating profit margin 3. Net profit margin 4. Times interest earned coverage 5. Return on shareholders' equity 6. Return on assets 7. Long-term debt-to-equity ratio 8. Days of inventory 9. Inventory turnover ratio 10. Average collection period Based on these...
P3-50. Analysis and Interpretation of Profitability Balance sheets and income statements for Costco Wholesale Corporation follow...
 P3-50. Analysis and Interpretation of Profitability Balance sheets and income statements for Costco Wholesale Corporation follow Aug. 30. 2015 Aug. 31, 2014 $113.666 2.533 116.199 $110.212 2.428 112.540 COSTCO WHOLESALE CORPORATION Consolidated Statements of income Aug. 20 For Fiscal Years Ended (5 millions) 2016 Revenue Net sales. $116.073 Membership fees. Total revenue. 118,719 Operating expenses Merchandise costs... 102 901 Selling, general and administrative...... 12.058 Preopening expenses............ Operating income.. 3.672 Other Income (expense) Interest expense..... . (1339 Interest Income and other...
PLease answer A-D P4-41. Analysis and Interpretation of Profitability Balance sheets and income statements for 3M...
 PLease answer A-D
P4-41. Analysis and Interpretation of Profitability Balance sheets and income statements for 3M Company follow. 3M COMPANY Consolidated Statements of Income For Years Ended Dec. 31 ($ millions) 2015 2013 2014 $31,821 $30,274 $30,871 15,383 6,182 1,763 16,447 6,469 1,770 24,686 7135 16,106 6,384 1,715 24,205 6,666 23,328 6,946 Net sales ............................................ Operating expenses Cost of sales. Selling, general and administrative expenses ......... Research, development and related expenses ........ Total operating expenses....... Operating income..... Interest expense and...
PLease answer A-D
P4-41. Analysis and Interpretation of Profitability Balance sheets and income statements for 3M Company follow. 3M COMPANY Consolidated Statements of Income For Years Ended Dec. 31 ($ millions) 2015 2013 2014 $31,821 $30,274 $30,871 15,383 6,182 1,763 16,447 6,469 1,770 24,686 7135 16,106 6,384 1,715 24,205 6,666 23,328 6,946 Net sales ............................................ Operating expenses Cost of sales. Selling, general and administrative expenses ......... Research, development and related expenses ........ Total operating expenses....... Operating income..... Interest expense and...
Using data available in the case, calculate the annual growth rate from 2014 to 2015, and from 2015 to 2016 (in percenta...
 Using data available in the case, calculate the annual growth
rate from 2014 to 2015, and from 2015 to 2016 (in percentages). All
calculations should be rounded to one decimal (e.g., 12.7%)
I need help filling in these percentages.
2014-2015 2015-2016 Revenue Cost of Goods Sold Gross Profit % Operating Income Total Operating Expenses Net Income % Working Capital Year Ended: Dec. 27, 2014 Dec. 31, 2016 Dec. 26, 2015 Income Statement Data: $968.99 $1,024.04 $966.48 Revenue 64.11 63.47 Less...
Using data available in the case, calculate the annual growth
rate from 2014 to 2015, and from 2015 to 2016 (in percentages). All
calculations should be rounded to one decimal (e.g., 12.7%)
I need help filling in these percentages.
2014-2015 2015-2016 Revenue Cost of Goods Sold Gross Profit % Operating Income Total Operating Expenses Net Income % Working Capital Year Ended: Dec. 27, 2014 Dec. 31, 2016 Dec. 26, 2015 Income Statement Data: $968.99 $1,024.04 $966.48 Revenue 64.11 63.47 Less...
ing assct lumover (NUAT)of 2016, CUI H Nin d. Compute net nonoperating obligations (NNO) for 2016...
 ing assct lumover (NUAT)of 2016, CUI H Nin d. Compute net nonoperating obligations (NNO) for 2016 and 2015. Confirm the relation: NOA = NNO + Total equity c. Compute return on equity (ROE) for 2016, Iofer the nonoperating return component of ROE for 2016, Comment on the difference between ROE and RNOA. What does this relation suggest about Casiente use of equity capital? P3-50. Analysis and Interpretation of Profitability Balance sheets and income statements for Costco Wholesale Corporation follow Aug....
Analysis and Interpretation of Profitability Balance sheets and income statements for 3M Company follow. 3M COMPANY...
Analysis and Interpretation of Profitability Balance sheets and income statements for 3M Company follow. 3M COMPANY Consolidated Statements of Income For Years ended December 31 ($ millions) 2015 2014 2013 Net sales $30,274 $31,821 $30,871 Operating expenses Cost of sales 15,383 16,447 16,106 Selling, general and administrative expenses 6,182 6,469 6,384 Research, development and related expenses 1,763 1,770 1,715 Total operating expenses 23,328 24,686 24,205 Operating income 6,946 7,135 6,666 Interest expenses and income Interest expense 149 142 145 Interest...
Ratios 2016 2015 a. Gross profit margin (%) 39.4 39.1 b. Operating profit margin (%) 5.1...
 Ratios
2016
2015
a.
Gross profit margin (%)
39.4
39.1
b.
Operating profit margin (%)
5.1
7.5
c.
Net profit margin (%)
2.4
4.0
d.
Return on shareholders' equity (%)
14.1
25.2
e.
Return on assets (%)
3.1
5.2
f.
Times interest earned coverage
3.6
5.6
g.
Long-term debt-to-equity ratio
1.5
3.8
h.
Days of inventory
126.2
121.8
i.
Inventory turnover ratio
2.9
3.0
j.
Average collection
period
7.4
7.5
1-From 2015 to 2016, Macy’s, Inc., return on equity and...
Ratios
2016
2015
a.
Gross profit margin (%)
39.4
39.1
b.
Operating profit margin (%)
5.1
7.5
c.
Net profit margin (%)
2.4
4.0
d.
Return on shareholders' equity (%)
14.1
25.2
e.
Return on assets (%)
3.1
5.2
f.
Times interest earned coverage
3.6
5.6
g.
Long-term debt-to-equity ratio
1.5
3.8
h.
Days of inventory
126.2
121.8
i.
Inventory turnover ratio
2.9
3.0
j.
Average collection
period
7.4
7.5
1-From 2015 to 2016, Macy’s, Inc., return on equity and...
 Analyze the various operating expenses as percentages of gross
profit for Jamba Juice in the last five years. Should Jamba Juice
try to increase the price of its products? What operating expenses
are hurting Jamba Juice the most? Suggest possible turnaround
actions the company should take.
JAMBA, INC. CONSOLIDATED BALANCE SHEETS December 29, 2016 7,099 55,997 December 29, 2015 8,990 64,625 December 30, 2011 9,544 75.744 (Dollars in thousands, except share and per share amounts) Deterred rent and other long-term...
Analyze the various operating expenses as percentages of gross
profit for Jamba Juice in the last five years. Should Jamba Juice
try to increase the price of its products? What operating expenses
are hurting Jamba Juice the most? Suggest possible turnaround
actions the company should take.
JAMBA, INC. CONSOLIDATED BALANCE SHEETS December 29, 2016 7,099 55,997 December 29, 2015 8,990 64,625 December 30, 2011 9,544 75.744 (Dollars in thousands, except share and per share amounts) Deterred rent and other long-term...
 I need help finding the Debt to Equity Ratio. Here are the two
balance sheets that were provided. I know that all of my other
calculations are correct.
answers should look like -0.05 or 1.33 2016 2015 2014 1.92 % 6.34 % 1.51 % Operating Income to Revenue 0.54 % 0.79% 1.04 % Current Ratio 0.20 Cash Ratio 0.35 0.27 Debt to Equity JAMBA, INC. CONSOLIDATED BALANCE SHEETS December 29, December 29, December 30, 2011 (Dollars in thousands, except share...
I need help finding the Debt to Equity Ratio. Here are the two
balance sheets that were provided. I know that all of my other
calculations are correct.
answers should look like -0.05 or 1.33 2016 2015 2014 1.92 % 6.34 % 1.51 % Operating Income to Revenue 0.54 % 0.79% 1.04 % Current Ratio 0.20 Cash Ratio 0.35 0.27 Debt to Equity JAMBA, INC. CONSOLIDATED BALANCE SHEETS December 29, December 29, December 30, 2011 (Dollars in thousands, except share...
 h. Days of inventory. 1. Inventory turnover ratio. J. Average collection period Based on these ratios, did Macy's financial performance improve, weaken, or remain about the same from 2015 to 2016? (479) 198 Consolidated Statements of Income for Macy's, Inc., 2015-2016 (in millions, except per share amounts) 2016 2015 Net sales $25,778 $27,079 Cost of sales (15,621) (16,496 Gross margin 10,157 10,583 Selling, general and administrative expenses (8,265) (8,256) Impairments, store closing and other costs (288) Settlement charges Operating income...
 ASSURANCE OF LEARNING EXERCISES 1. conn LO4-1 Using the financial ratios provided in the Appendix and the following financial statement information for Macy's, Inc., calculate the following ratios for Macy's for both 2015 and 2016. 1. Gross profit margin 2. Operating profit margin 3. Net profit margin 4. Times interest earned coverage 5. Return on shareholders' equity 6. Return on assets 7. Long-term debt-to-equity ratio 8. Days of inventory 9. Inventory turnover ratio 10. Average collection period Based on these...
 P3-50. Analysis and Interpretation of Profitability Balance sheets and income statements for Costco Wholesale Corporation follow Aug. 30. 2015 Aug. 31, 2014 $113.666 2.533 116.199 $110.212 2.428 112.540 COSTCO WHOLESALE CORPORATION Consolidated Statements of income Aug. 20 For Fiscal Years Ended (5 millions) 2016 Revenue Net sales. $116.073 Membership fees. Total revenue. 118,719 Operating expenses Merchandise costs... 102 901 Selling, general and administrative...... 12.058 Preopening expenses............ Operating income.. 3.672 Other Income (expense) Interest expense..... . (1339 Interest Income and other...
 PLease answer A-D
P4-41. Analysis and Interpretation of Profitability Balance sheets and income statements for 3M Company follow. 3M COMPANY Consolidated Statements of Income For Years Ended Dec. 31 ($ millions) 2015 2013 2014 $31,821 $30,274 $30,871 15,383 6,182 1,763 16,447 6,469 1,770 24,686 7135 16,106 6,384 1,715 24,205 6,666 23,328 6,946 Net sales ............................................ Operating expenses Cost of sales. Selling, general and administrative expenses ......... Research, development and related expenses ........ Total operating expenses....... Operating income..... Interest expense and...
PLease answer A-D
P4-41. Analysis and Interpretation of Profitability Balance sheets and income statements for 3M Company follow. 3M COMPANY Consolidated Statements of Income For Years Ended Dec. 31 ($ millions) 2015 2013 2014 $31,821 $30,274 $30,871 15,383 6,182 1,763 16,447 6,469 1,770 24,686 7135 16,106 6,384 1,715 24,205 6,666 23,328 6,946 Net sales ............................................ Operating expenses Cost of sales. Selling, general and administrative expenses ......... Research, development and related expenses ........ Total operating expenses....... Operating income..... Interest expense and...
 Using data available in the case, calculate the annual growth
rate from 2014 to 2015, and from 2015 to 2016 (in percentages). All
calculations should be rounded to one decimal (e.g., 12.7%)
I need help filling in these percentages.
2014-2015 2015-2016 Revenue Cost of Goods Sold Gross Profit % Operating Income Total Operating Expenses Net Income % Working Capital Year Ended: Dec. 27, 2014 Dec. 31, 2016 Dec. 26, 2015 Income Statement Data: $968.99 $1,024.04 $966.48 Revenue 64.11 63.47 Less...
Using data available in the case, calculate the annual growth
rate from 2014 to 2015, and from 2015 to 2016 (in percentages). All
calculations should be rounded to one decimal (e.g., 12.7%)
I need help filling in these percentages.
2014-2015 2015-2016 Revenue Cost of Goods Sold Gross Profit % Operating Income Total Operating Expenses Net Income % Working Capital Year Ended: Dec. 27, 2014 Dec. 31, 2016 Dec. 26, 2015 Income Statement Data: $968.99 $1,024.04 $966.48 Revenue 64.11 63.47 Less...
 ing assct lumover (NUAT)of 2016, CUI H Nin d. Compute net nonoperating obligations (NNO) for 2016 and 2015. Confirm the relation: NOA = NNO + Total equity c. Compute return on equity (ROE) for 2016, Iofer the nonoperating return component of ROE for 2016, Comment on the difference between ROE and RNOA. What does this relation suggest about Casiente use of equity capital? P3-50. Analysis and Interpretation of Profitability Balance sheets and income statements for Costco Wholesale Corporation follow Aug....
 Ratios
2016
2015
a.
Gross profit margin (%)
39.4
39.1
b.
Operating profit margin (%)
5.1
7.5
c.
Net profit margin (%)
2.4
4.0
d.
Return on shareholders' equity (%)
14.1
25.2
e.
Return on assets (%)
3.1
5.2
f.
Times interest earned coverage
3.6
5.6
g.
Long-term debt-to-equity ratio
1.5
3.8
h.
Days of inventory
126.2
121.8
i.
Inventory turnover ratio
2.9
3.0
j.
Average collection
period
7.4
7.5
1-From 2015 to 2016, Macy’s, Inc., return on equity and...
Ratios
2016
2015
a.
Gross profit margin (%)
39.4
39.1
b.
Operating profit margin (%)
5.1
7.5
c.
Net profit margin (%)
2.4
4.0
d.
Return on shareholders' equity (%)
14.1
25.2
e.
Return on assets (%)
3.1
5.2
f.
Times interest earned coverage
3.6
5.6
g.
Long-term debt-to-equity ratio
1.5
3.8
h.
Days of inventory
126.2
121.8
i.
Inventory turnover ratio
2.9
3.0
j.
Average collection
period
7.4
7.5
1-From 2015 to 2016, Macy’s, Inc., return on equity and...
Most questions answered within 3 hours.
-
A uniform magnetic field is perpendicular to the plane of a wire
loop. If the loop...
asked 7 minutes ago -
Preparation of Benzoic Acid using a Grignard Reagent URGENT
1. During your Grignard formation, a small...
asked 8 minutes ago -
At the peak of your career, your were earning $120,000 and
holding a top level position....
asked 10 minutes ago -
. A permanent magnet is dropped south-end-down through a horizontal
circular coil with a radius of...
asked 12 minutes ago -
Bernie's Beverages purchased some fixed assets classified as
5-year property for MACRS. The assets cost $28,000....
asked 26 minutes ago -
How many ATPs are produced from the catabolism of a 10-C
molecule of fatty acid under...
asked 31 minutes ago -
Before practicing a routine on the rings, a 64.8 kg gymnast
hangs motionless, with one hand...
asked 33 minutes ago -
If the K b of a weak base is 6.3 × 10 − 6 , what...
asked 39 minutes ago -
Which of the following is the minimum amount of moles of NaOH
that must be added...
asked 43 minutes ago -
Stories about organizational ________ provide important clues
about cultural values and norms.
a. myths
b. heroes...
asked 44 minutes ago -
Explain the criteria used in selecting a target market
BUS220 Retail Management, thank you!
asked 46 minutes ago -
Convert/Calculate the following:
Determine the identity of an elemental gas if 4.55 L weighing
35.4g, under...
asked 49 minutes ago