Analysis and Interpretation of Profitability Balance sheets and income statements for 3M Company follow. 3M COMPANY...
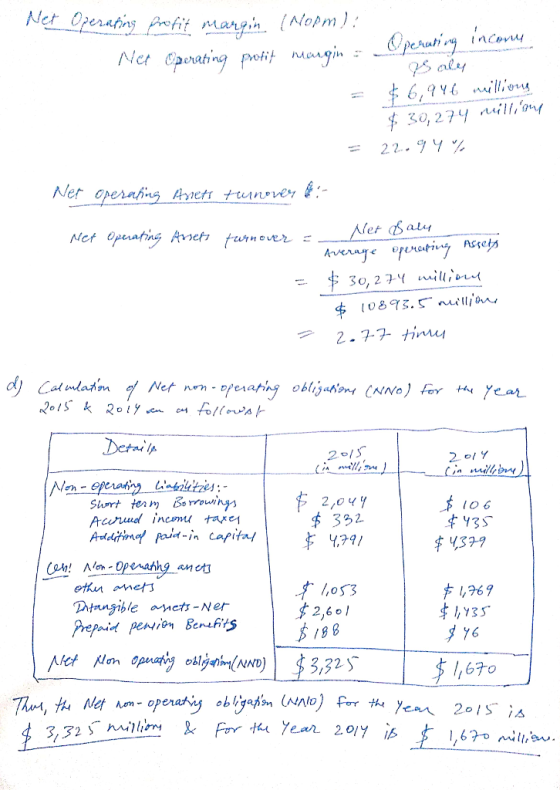
Analysis and Interpretation of Profitability Balance sheets and income statements for 3M Company follow. 3M COMPANY Consolidated Statements of Income For Years ended December 31 ($ millions) 2015 2014 2013 Net sales $30,274 $31,821 $30,871 Operating expenses Cost of sales 15,383 16,447 16,106 Selling, general and administrative expenses 6,182 6,469 6,384 Research, development and related expenses 1,763 1,770 1,715 Total operating expenses 23,328 24,686 24,205 Operating income 6,946 7,135 6,666 Interest expenses and income Interest expense 149 142 145 Interest income (26) (33) (41) Total interest expense--net 123 109 104 Income before income taxes 6,823 7,026 6,562 Provision for income taxes 1,982 2,028 1,841 Net income including noncontrolling interest $4,841 $4,998 $4,721 Less: Net income attributable to noncontrolling interest 8 42 62 Net income attributable to 3M $ 4,833 $ 4,956 $ 4,659 3M COMPANY Consolidated Balance Sheets At December 31 ($ millions, except per share amount) 2015 2014 Current Assets Cash and cash equivalents $1,798 $1,897 Marketable securities-current 118 1,439 Accounts receivable-net of allowances of $91 and $94 4,154 4,238 Inventories Finished goods 1,655 1,723 Work in process 1,008 1,081 Raw materials and supplies 855 902 Total inventories 3,518 3,706 Other current assets 1,398 1,023 Total current assets 10,986 12,303 Marketable securities-noncurrent 9 15 Investments 117 102 Property, plant and equipment 23,098 22,841 Less: Accumulated depreciation (14,583) (14,352) Property, plant and equipment-net 8,515 8,489 Goodwill 9,249 7,050 Intangible assets-net 2,601 1,435 Prepaid pension benefits 188 46 Other assets 1,053 1,769 Total assets $32,718 $31,209 Liabilities Current liabilities Short-term borrowings and current portion of long-term debt $2,044 $106 Accounts payable 1,694 1,807 Accrued payroll 644 732 Accrued income taxes 332 435 Other current liabilities 2,404 2,884 Total current liabilities 7,118 5,964 Long-term debt 8,753 6,705 Pension and postretirement benefits 3,520 3,843 Other liabilities 1,580 1,555 Total liabilities $20,971 $18,067 Equity 3M Company shareholders' equity Common stock, par value $0.01 per share: Shares outstanding-2015: 609,330,124; Shares outstanding-2014: 635,134,594 $9 $9 Additional paid-in capital 4,791 4,379 Retained earnings 36,575 34,317 Treasury stock (23,308) (19,307) Accumulated other comprehensive income (loss) (6,359) (6,289) Total 3M Company shareholders' equity 11,708 13,109 Noncontrolling interest 39 33 Total equity $11,747 $13,142 Total liabilities and equity $32,718 $31,209 (a) Compute net operating profit after tax (NOPAT) for 2015. Assume that the combined federal and statutory rate is: 37.0% (Round your answer to the nearest whole number.) 2015 NOPAT =Answer ($ millions) (b) Compute net operating assets (NOA) for 2015 and 2014. Treat noncurrent investments as a nonoperating item. 2015 NOA =Answer ($ millions) 2014 NOA =Answer ($ millions) (c) Compute 3M's RNOA, net operating profit margin (NOPM) and net operating asset turnover (NOAT) for 2015. (Round your answers to two decimal places. Do not round until your final answer. Do not use NOPM x NOAT to calculate RNOA.) 2015 RNOA =Answer % 2015 NOPM =Answer % 2015 NOAT =Answer (d) Compute net nonoperating obligations (NNO) for 2015 and 2014. 2015 NNO =Answer ($ millions) 2014 NNO =Answer ($ millions)
Homework Answers

Add Answer to:
Analysis and Interpretation of Profitability Balance sheets and income statements for 3M Company follow. 3M COMPANY...
Analysis and Interpretation of Profitability Balance sheets and income statements for 3M Company follow. 3M COMPANY...
 Analysis and Interpretation of Profitability Balance sheets and income statements for 3M Company follow. 3M COMPANY Consolidated Statements of Income For Years ended December 31 ($ millions) 2015 2014 2013 Net sales $30,274 $31,821 $30,871 Operating expenses Cost of sales 15,383 16,447 16,106 Selling, general and administrative expenses 6,182 6,469 6,384 Research, development and related expenses 1,763 1,770 1,715 Total operating expenses 23,328 24,686 24,205 Operating income 6,946 7,135 6,666 Interest expenses and income Interest expense 149 142 145 Interest...
Analysis and Interpretation of Profitability Balance sheets and income statements for 3M Company follow. 3M COMPANY...
 Analysis and Interpretation of Profitability Balance sheets and income statements for 3M Company follow. 3M COMPANY Consolidated Statements of Income For Years ended December 31 (5 millions) 2018 2017 Net sales $32,765 $31,657 Operating expenses Cost of sales 16,682 16,055 Selling, general and administrative expenses 7,602 6,626 Research, development and related expenses 1,821 1,870 Gain on sale of businesses (547) Total operating expenses 25,558 23,965 Operating income 7,207 7,692 Other expense, net* 207 144 Income before income taxes 7,000 7,548...
PLease answer A-D P4-41. Analysis and Interpretation of Profitability Balance sheets and income statements for 3M...
 PLease answer A-D
P4-41. Analysis and Interpretation of Profitability Balance sheets and income statements for 3M Company follow. 3M COMPANY Consolidated Statements of Income For Years Ended Dec. 31 ($ millions) 2015 2013 2014 $31,821 $30,274 $30,871 15,383 6,182 1,763 16,447 6,469 1,770 24,686 7135 16,106 6,384 1,715 24,205 6,666 23,328 6,946 Net sales ............................................ Operating expenses Cost of sales. Selling, general and administrative expenses ......... Research, development and related expenses ........ Total operating expenses....... Operating income..... Interest expense and...
PLease answer A-D
P4-41. Analysis and Interpretation of Profitability Balance sheets and income statements for 3M Company follow. 3M COMPANY Consolidated Statements of Income For Years Ended Dec. 31 ($ millions) 2015 2013 2014 $31,821 $30,274 $30,871 15,383 6,182 1,763 16,447 6,469 1,770 24,686 7135 16,106 6,384 1,715 24,205 6,666 23,328 6,946 Net sales ............................................ Operating expenses Cost of sales. Selling, general and administrative expenses ......... Research, development and related expenses ........ Total operating expenses....... Operating income..... Interest expense and...
Analysis and Interpretation of Profitability Balance sheets and income statements for 3M Company follow. Consolidated Statements...
 Analysis and Interpretation of Profitability Balance sheets and income statements for 3M Company follow. Consolidated Statements of Income Years ended December 31 ($ millions), 2007 2006 2005 Net sales $24,462 $22,923 $21,167 Operating expenses Cost of sales 12,735 11,713 10,408 Selling, general and administrative expenses 5,015 5,066 4,631 Research, development and related expenses 1,368 1,522 1,274 Loss/(gain) from sale of business (849) (1,074) Total operating expenses 18,269 17,227 16,313 Operating income 6,193 5,696 4,854 Interest expenses and income Interest expense...
Analysis and Interpretation of Profitability Balance sheets and income statements for 3M Company follow. Consolidated Statements...
Analysis and Interpretation of Profitability Balance sheets and income statements for 3M Company follow. Consolidated Statements of Income Years ended December 31 ($ millions) 2012 2011 2010 Net sales $29,904 $ 29,611 $ 226,662 Operating expenses Cost of sales 15,685 15,693 13,831 Selling, general and administrative expenses 6,102 6,170 5,479 Research, development and related expenses 1,634 1,570 1,434 -- -- -- Total operating expenses 23,421 23,433 20,744 Operating income 6,483 6,178 5,918 Interest expenses and income Interest expense 171 186...
Analysis and Interpretation of Profitability Balance sheets and income statements for 3M Company follow. Consolidated Statements...
Analysis and Interpretation of Profitability Balance sheets and income statements for 3M Company follow. Consolidated Statements of Income Years ended December 31 ($ millions) 2007 2006 2005 Net sales $24,462 $22,923 $21,167 Operating expenses Cost of sales 12,735 11,713 10,408 Selling, general and administrative expenses 5,015 5,066 4,631 Research, development and related expenses 1,368 1,522 1,274 Loss/(gain) from sale of business (849) (1,074) -- Total operating expenses 18,269 17,227 16,313 Operating income 6,193 5,696 4,854 Interest expenses and income Interest...
Analysis and Interpretation of Profitability Balance sheets and income statements for 3M Company follow. Consolidated Statements...
Analysis and Interpretation of Profitability Balance sheets and income statements for 3M Company follow. Consolidated Statements of Income Years ended December 31 ($ millions) 2010 2009 2008 Net sales $26,662 $23,123 $25,269 Operating expenses Cost of sales 13,831 12,109 13,379 Selling, general and administrative expenses 5,479 4,907 5,245 Research, development and related expenses 1,434 1,293 1,404 Loss/(gain) from sale of business -- -- 23 Total operating expenses 20,744 18,309 20,051 Operating income 5,918 4,814 5,218 Interest expenses and income Interest...
Analysis and Interpretation of Profitability Balance sheets and income statements for 3M Company follow. Consolidated Statements...
 Analysis and Interpretation of Profitability Balance sheets and income statements for 3M Company follow. Consolidated Statements of Income Years ended December 31 ($ millions) 2007 2006 2005 Net sales $24,462 $22,923 $21,167 Operating expenses Cost of sales 12,735 11,713 10,408 Selling, general and administrative expenses 5,015 5,066 4,631 Research, development and related expenses 1,368 1,522 1,274 Loss/(gain) from sale of business (849) (1,074) Total operating expenses 18,269 17.227 16,313 Operating income 6,193 5,696 4,854 Interest expenses and income Interest expense...
please help with correct answer. i need help urgently Analysis and Interpretation of Profitability Balance sheets...
 please help with correct answer. i need help urgently
Analysis and Interpretation of Profitability Balance sheets and income statements for 3M Company follow. 3M COMPANY Consolidated Statements of Income For Years ended December 31 ($ millions) 2015 2014 2013 Net sales $30,274 $31,821 $30,871 Operating expenses Cost of sales 15,383 16,447 16,106 Selling, general and administrative expenses 6,182 6,469 6,384 Research, development and related expenses 1,763 1,770 1,715 Total operating expenses 23,328 24,686 24,205 Operating income 6,946 7135 6,666 Interest...
please help with correct answer. i need help urgently
Analysis and Interpretation of Profitability Balance sheets and income statements for 3M Company follow. 3M COMPANY Consolidated Statements of Income For Years ended December 31 ($ millions) 2015 2014 2013 Net sales $30,274 $31,821 $30,871 Operating expenses Cost of sales 15,383 16,447 16,106 Selling, general and administrative expenses 6,182 6,469 6,384 Research, development and related expenses 1,763 1,770 1,715 Total operating expenses 23,328 24,686 24,205 Operating income 6,946 7135 6,666 Interest...
Analysis and Interpretation of Profitability Balance sheets and income statements for 3M Company follow. Consolidated Statements...
Analysis and Interpretation of Profitability Balance sheets and income statements for 3M Company follow. Consolidated Statements of Income Years ended December 31 ($ millions) 2010 2009 2008 Net sales $26,662 $23,123 $25,269 Operating expenses Cost of sales 13,831 12,109 13,379 Selling, general and administrative expenses 5,479 4,907 5,245 Research, development and related expenses 1,434 1,293 1,404 Loss/(gain) from sale of business -- -- 23 Total operating expenses 20,744 18,309 20,051 Operating income 5,918 4,814 5,218 Interest expenses and income Interest...
 Analysis and Interpretation of Profitability Balance sheets and income statements for 3M Company follow. 3M COMPANY Consolidated Statements of Income For Years ended December 31 ($ millions) 2015 2014 2013 Net sales $30,274 $31,821 $30,871 Operating expenses Cost of sales 15,383 16,447 16,106 Selling, general and administrative expenses 6,182 6,469 6,384 Research, development and related expenses 1,763 1,770 1,715 Total operating expenses 23,328 24,686 24,205 Operating income 6,946 7,135 6,666 Interest expenses and income Interest expense 149 142 145 Interest...
 Analysis and Interpretation of Profitability Balance sheets and income statements for 3M Company follow. 3M COMPANY Consolidated Statements of Income For Years ended December 31 (5 millions) 2018 2017 Net sales $32,765 $31,657 Operating expenses Cost of sales 16,682 16,055 Selling, general and administrative expenses 7,602 6,626 Research, development and related expenses 1,821 1,870 Gain on sale of businesses (547) Total operating expenses 25,558 23,965 Operating income 7,207 7,692 Other expense, net* 207 144 Income before income taxes 7,000 7,548...
 PLease answer A-D
P4-41. Analysis and Interpretation of Profitability Balance sheets and income statements for 3M Company follow. 3M COMPANY Consolidated Statements of Income For Years Ended Dec. 31 ($ millions) 2015 2013 2014 $31,821 $30,274 $30,871 15,383 6,182 1,763 16,447 6,469 1,770 24,686 7135 16,106 6,384 1,715 24,205 6,666 23,328 6,946 Net sales ............................................ Operating expenses Cost of sales. Selling, general and administrative expenses ......... Research, development and related expenses ........ Total operating expenses....... Operating income..... Interest expense and...
PLease answer A-D
P4-41. Analysis and Interpretation of Profitability Balance sheets and income statements for 3M Company follow. 3M COMPANY Consolidated Statements of Income For Years Ended Dec. 31 ($ millions) 2015 2013 2014 $31,821 $30,274 $30,871 15,383 6,182 1,763 16,447 6,469 1,770 24,686 7135 16,106 6,384 1,715 24,205 6,666 23,328 6,946 Net sales ............................................ Operating expenses Cost of sales. Selling, general and administrative expenses ......... Research, development and related expenses ........ Total operating expenses....... Operating income..... Interest expense and...
 Analysis and Interpretation of Profitability Balance sheets and income statements for 3M Company follow. Consolidated Statements of Income Years ended December 31 ($ millions), 2007 2006 2005 Net sales $24,462 $22,923 $21,167 Operating expenses Cost of sales 12,735 11,713 10,408 Selling, general and administrative expenses 5,015 5,066 4,631 Research, development and related expenses 1,368 1,522 1,274 Loss/(gain) from sale of business (849) (1,074) Total operating expenses 18,269 17,227 16,313 Operating income 6,193 5,696 4,854 Interest expenses and income Interest expense...
 Analysis and Interpretation of Profitability Balance sheets and income statements for 3M Company follow. Consolidated Statements of Income Years ended December 31 ($ millions) 2007 2006 2005 Net sales $24,462 $22,923 $21,167 Operating expenses Cost of sales 12,735 11,713 10,408 Selling, general and administrative expenses 5,015 5,066 4,631 Research, development and related expenses 1,368 1,522 1,274 Loss/(gain) from sale of business (849) (1,074) Total operating expenses 18,269 17.227 16,313 Operating income 6,193 5,696 4,854 Interest expenses and income Interest expense...
 please help with correct answer. i need help urgently
Analysis and Interpretation of Profitability Balance sheets and income statements for 3M Company follow. 3M COMPANY Consolidated Statements of Income For Years ended December 31 ($ millions) 2015 2014 2013 Net sales $30,274 $31,821 $30,871 Operating expenses Cost of sales 15,383 16,447 16,106 Selling, general and administrative expenses 6,182 6,469 6,384 Research, development and related expenses 1,763 1,770 1,715 Total operating expenses 23,328 24,686 24,205 Operating income 6,946 7135 6,666 Interest...
please help with correct answer. i need help urgently
Analysis and Interpretation of Profitability Balance sheets and income statements for 3M Company follow. 3M COMPANY Consolidated Statements of Income For Years ended December 31 ($ millions) 2015 2014 2013 Net sales $30,274 $31,821 $30,871 Operating expenses Cost of sales 15,383 16,447 16,106 Selling, general and administrative expenses 6,182 6,469 6,384 Research, development and related expenses 1,763 1,770 1,715 Total operating expenses 23,328 24,686 24,205 Operating income 6,946 7135 6,666 Interest...
Most questions answered within 3 hours.
-
The highly pathogenic bacterium Clostridium
perfringens causes gangrene, a disease that results in the
destruction of...
asked 1 hour ago -
In the context of situation analysis, which of the following is
a category for analysis in...
asked 1 hour ago -
In a study of the gas phase decomposition of sulfuryl chloride
at 600 K SO2Cl2(g)SO2(g) +...
asked 1 hour ago -
75 g of 2-propanol (C3H8O) and 25 g of pentane are mixed in a
200 mL...
asked 1 hour ago -
The 2800-turn coil in a dc motor has an area per turn of 1.1 ×
10-2...
asked 1 hour ago -
Draw a combinational logic circuit diagram with a symbol inside
the box for two I/P of...
asked 1 hour ago -
The cliché we use quite a lot in finance is: there is a need to
maximize...
asked 1 hour ago -
In class we discussed the addition of HCl to alpha pinene. Would
you expect one or...
asked 1 hour ago -
I'm trying to explain to my daughter to help her please help
me
I tagged the...
asked 1 hour ago -
You want to accumulate $28,000 in 10 years using annual
payments, the first one in a...
asked 1 hour ago -
1. Name the 4 products obtained from the reactions of the light phase of photosynthesis.
2....
asked 1 hour ago -
An electron in an excited hydrogen atom makes two transitions.
First the electron drops from the...
asked 2 hours ago