
Homework Answers
Please note the following before you look into the solution:
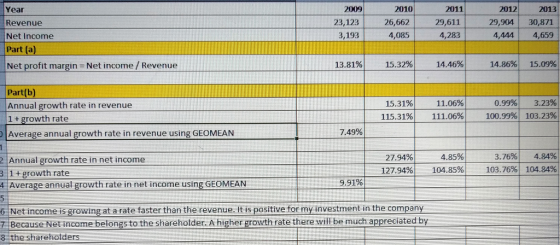
- I have reversed the sequence of data to read from the year 2009 to year 2013.
- The solution is split across four pictures:
- First picture shows the formula used in all the cells
- Second and third picture show the output in each cell
- Fourth picture is the graph
- After typing the formula,please change the format to "Percentage %" so that all your growth rates are in %age terms.
Please see the solution below now:


Add Answer to:
Please show in excel with formulas
In your position as research assistant to a portfolio manager,...
Please show in excel with formulas 1. Suppose that at the end of December 2008 you...
 Please show in excel with formulas
1. Suppose that at the end of December 2008 you purchased Inc. (Nasdaq: AAPL). It is now five years later and you decide tApple, your holdings to see if you have done well with this inv below shows the end-of-year market prices of AAP table AAPL Stock Prices Date 2008 2009 203.76 2010 311.89 2011 391.60 2012 519.13 2013 561.02 Price 82.53 Enter the data, as shown, into a worksheet and format the table...
Please show in excel with formulas
1. Suppose that at the end of December 2008 you purchased Inc. (Nasdaq: AAPL). It is now five years later and you decide tApple, your holdings to see if you have done well with this inv below shows the end-of-year market prices of AAP table AAPL Stock Prices Date 2008 2009 203.76 2010 311.89 2011 391.60 2012 519.13 2013 561.02 Price 82.53 Enter the data, as shown, into a worksheet and format the table...
Please show how to find the values for the yellow cells in excel with the excel...
 Please show how to find the values for the yellow cells in excel
with the excel functions required to get the answer. thanks
4,568,199 30.00% Sample Question 5 (x marks) (a) From the extracts of the company's Year ending 30-Jun-13 financial statements, work out last year's Cash $11,345,576 (year ending 30 June 2013) free cash flow and Other assets $154,269,130 Number of shares on issue display the FCF in cell C23. Debt and liabilities $57,546,119 Company tax rate Equity (book...
Please show how to find the values for the yellow cells in excel
with the excel functions required to get the answer. thanks
4,568,199 30.00% Sample Question 5 (x marks) (a) From the extracts of the company's Year ending 30-Jun-13 financial statements, work out last year's Cash $11,345,576 (year ending 30 June 2013) free cash flow and Other assets $154,269,130 Number of shares on issue display the FCF in cell C23. Debt and liabilities $57,546,119 Company tax rate Equity (book...
I have inserted the formulas needed to calculate the income statement. However I do not know...
 I have inserted the formulas needed to calculate the income
statement. However I do not know how to enter the formulas for my
assumptions that are highlighted on the right.
I am trying to create a forecasted income statement in excel
from 2011 (original data) -through 2017 (forecasted data) . Can you
help me with this.
Net sales 2011 2012 2013 2014 2015 2016 2017 Assumptions 965,922 forecast forecast forecast forecast forecast forecast Increase Year by 3% Maintain the 2011...
I have inserted the formulas needed to calculate the income
statement. However I do not know how to enter the formulas for my
assumptions that are highlighted on the right.
I am trying to create a forecasted income statement in excel
from 2011 (original data) -through 2017 (forecasted data) . Can you
help me with this.
Net sales 2011 2012 2013 2014 2015 2016 2017 Assumptions 965,922 forecast forecast forecast forecast forecast forecast Increase Year by 3% Maintain the 2011...
I have inserted the formulas needed to calculate the income statement. However I do not know...
 I have inserted the formulas needed to calculate the income
statement. However I do not know how to enter the formulas for my
assumptions that are highlighted on the right.
May you please provide the formula to complete
the assumptions so I can understand what I am doing
I am trying to create a forecasted income statement in excel
from 2011 (original data) -through 2017 (forecasted data) . Can you
help me with this.
Net sales 2011 2012 2013 2014...
I have inserted the formulas needed to calculate the income
statement. However I do not know how to enter the formulas for my
assumptions that are highlighted on the right.
May you please provide the formula to complete
the assumptions so I can understand what I am doing
I am trying to create a forecasted income statement in excel
from 2011 (original data) -through 2017 (forecasted data) . Can you
help me with this.
Net sales 2011 2012 2013 2014...
Can this question please be answered? 1) Using the formulas in Table 4.1 and Urban Outfitters’s...
 Can this question please be answered?
1) Using the formulas in Table 4.1 and Urban Outfitters’s
financial statement starting on page 117, calculate the following
measures of financial performance. Be sure to report items (a)
through (e) in percentages (i.e., multiply your result x 100).
a. Gross profit margin
b. Operating profit margin
c. Net profit margin
d. Times-interest-earned (or coverage) ratio
e. Return on stockholders’ equity
f. Return on assets
g. Debt-to-equity ratio
h. Days of inventory
i. Inventory...
Can this question please be answered?
1) Using the formulas in Table 4.1 and Urban Outfitters’s
financial statement starting on page 117, calculate the following
measures of financial performance. Be sure to report items (a)
through (e) in percentages (i.e., multiply your result x 100).
a. Gross profit margin
b. Operating profit margin
c. Net profit margin
d. Times-interest-earned (or coverage) ratio
e. Return on stockholders’ equity
f. Return on assets
g. Debt-to-equity ratio
h. Days of inventory
i. Inventory...
Excel assignment: Here are the instructions Please help with the formulas needed thank you. #28-30 are...
 Excel assignment: Here are the instructions Please help with the
formulas needed thank you. #28-30 are missing in the excel
screenshot. They are
#28 Tax
#29 Net Income
#30 Cash Flow
Product Selling Prices: Oysters on half shell will sell for
$8.25 each (dozen) Fried Shrimp will sell for $10.25 (dozen)
Calamari will sell for $4.95 an order Catfish Sandwich will sell
for $5.95 Salads will sell for $4.50 each Fries sell for $1.25 per
order Sodas sell for $1.25...
Excel assignment: Here are the instructions Please help with the
formulas needed thank you. #28-30 are missing in the excel
screenshot. They are
#28 Tax
#29 Net Income
#30 Cash Flow
Product Selling Prices: Oysters on half shell will sell for
$8.25 each (dozen) Fried Shrimp will sell for $10.25 (dozen)
Calamari will sell for $4.95 an order Catfish Sandwich will sell
for $5.95 Salads will sell for $4.50 each Fries sell for $1.25 per
order Sodas sell for $1.25...
please answer in excel format and provide formulas. G E 84 C C Play Ode to...
 please answer in excel format and provide formulas.
G E 84 C C Play Ode to Joy 2 Cick bere for a gcod time Sales for First Quarter 100% Sheetl Reatu Figure 5-28. Using the HYPERLINK function. COMPUTER EXERCISES We Love Plants, Inc. is a small company in the houseplant care business. People c for the company to come into their apartment or house to care for their plants when they a away on business or on vacation or all-year...
please answer in excel format and provide formulas.
G E 84 C C Play Ode to Joy 2 Cick bere for a gcod time Sales for First Quarter 100% Sheetl Reatu Figure 5-28. Using the HYPERLINK function. COMPUTER EXERCISES We Love Plants, Inc. is a small company in the houseplant care business. People c for the company to come into their apartment or house to care for their plants when they a away on business or on vacation or all-year...
Instructions: By using the above information, please calculate the ROA, show all work and your interpretation....
 Instructions: By using the above information,
please calculate the ROA, show all work and your
interpretation.
[1] Return on Asset:
ROA = (net income) + ( 1 – tax rate)(interest exp) + minority
interest in earning / Average Total Assets
EXXON MOBIL CORPORATION CONDENSED CONSOLIDATED BALANCE SHEET (millions of dollars) Sept. 30, 2018 5,669 27,880 Assets Current assets Cash and cash equivalents Notes and accounts receivable -- net Inventories Crude oil, products and merchandise Materials and supplies Other current assets...
Instructions: By using the above information,
please calculate the ROA, show all work and your
interpretation.
[1] Return on Asset:
ROA = (net income) + ( 1 – tax rate)(interest exp) + minority
interest in earning / Average Total Assets
EXXON MOBIL CORPORATION CONDENSED CONSOLIDATED BALANCE SHEET (millions of dollars) Sept. 30, 2018 5,669 27,880 Assets Current assets Cash and cash equivalents Notes and accounts receivable -- net Inventories Crude oil, products and merchandise Materials and supplies Other current assets...
PLEASE help! the paper are the instructions to fill in the boxes in the excel sheet...
 PLEASE help! the paper are the instructions to fill in the
boxes in the excel sheet
eating a multiproduct profitability fthis project is to give the effects of changing business conditions on the The purposes can be used to deters will be to use Excel such a way that any changes to the Excel CVP Modeling project The purpose of this project is to give you experience creating a mi analysis that can be used to determine the effects of...
PLEASE help! the paper are the instructions to fill in the
boxes in the excel sheet
eating a multiproduct profitability fthis project is to give the effects of changing business conditions on the The purposes can be used to deters will be to use Excel such a way that any changes to the Excel CVP Modeling project The purpose of this project is to give you experience creating a mi analysis that can be used to determine the effects of...
Please show the functions that are required as well as what to enter into each function to get the correct output. excel is preferred over hand written. 4 ABC Manufacturing expects to sell 1,025 u...
 Please show the functions that are required as well as what to
enter into each function to get the correct output. excel is
preferred over hand written.
4 ABC Manufacturing expects to sell 1,025 units of product in 2019 at an average price of S100,000 per unit based on current demand The Chief Marketing Officer forecasts growth of 50 units per year through 2023. So, the demand will be 1,025 units in 2019, 1,075 units n 2020, etc. and the...
Please show the functions that are required as well as what to
enter into each function to get the correct output. excel is
preferred over hand written.
4 ABC Manufacturing expects to sell 1,025 units of product in 2019 at an average price of S100,000 per unit based on current demand The Chief Marketing Officer forecasts growth of 50 units per year through 2023. So, the demand will be 1,025 units in 2019, 1,075 units n 2020, etc. and the...
 Please show in excel with formulas
1. Suppose that at the end of December 2008 you purchased Inc. (Nasdaq: AAPL). It is now five years later and you decide tApple, your holdings to see if you have done well with this inv below shows the end-of-year market prices of AAP table AAPL Stock Prices Date 2008 2009 203.76 2010 311.89 2011 391.60 2012 519.13 2013 561.02 Price 82.53 Enter the data, as shown, into a worksheet and format the table...
Please show in excel with formulas
1. Suppose that at the end of December 2008 you purchased Inc. (Nasdaq: AAPL). It is now five years later and you decide tApple, your holdings to see if you have done well with this inv below shows the end-of-year market prices of AAP table AAPL Stock Prices Date 2008 2009 203.76 2010 311.89 2011 391.60 2012 519.13 2013 561.02 Price 82.53 Enter the data, as shown, into a worksheet and format the table...
 Please show how to find the values for the yellow cells in excel
with the excel functions required to get the answer. thanks
4,568,199 30.00% Sample Question 5 (x marks) (a) From the extracts of the company's Year ending 30-Jun-13 financial statements, work out last year's Cash $11,345,576 (year ending 30 June 2013) free cash flow and Other assets $154,269,130 Number of shares on issue display the FCF in cell C23. Debt and liabilities $57,546,119 Company tax rate Equity (book...
Please show how to find the values for the yellow cells in excel
with the excel functions required to get the answer. thanks
4,568,199 30.00% Sample Question 5 (x marks) (a) From the extracts of the company's Year ending 30-Jun-13 financial statements, work out last year's Cash $11,345,576 (year ending 30 June 2013) free cash flow and Other assets $154,269,130 Number of shares on issue display the FCF in cell C23. Debt and liabilities $57,546,119 Company tax rate Equity (book...
 I have inserted the formulas needed to calculate the income
statement. However I do not know how to enter the formulas for my
assumptions that are highlighted on the right.
I am trying to create a forecasted income statement in excel
from 2011 (original data) -through 2017 (forecasted data) . Can you
help me with this.
Net sales 2011 2012 2013 2014 2015 2016 2017 Assumptions 965,922 forecast forecast forecast forecast forecast forecast Increase Year by 3% Maintain the 2011...
I have inserted the formulas needed to calculate the income
statement. However I do not know how to enter the formulas for my
assumptions that are highlighted on the right.
I am trying to create a forecasted income statement in excel
from 2011 (original data) -through 2017 (forecasted data) . Can you
help me with this.
Net sales 2011 2012 2013 2014 2015 2016 2017 Assumptions 965,922 forecast forecast forecast forecast forecast forecast Increase Year by 3% Maintain the 2011...
 I have inserted the formulas needed to calculate the income
statement. However I do not know how to enter the formulas for my
assumptions that are highlighted on the right.
May you please provide the formula to complete
the assumptions so I can understand what I am doing
I am trying to create a forecasted income statement in excel
from 2011 (original data) -through 2017 (forecasted data) . Can you
help me with this.
Net sales 2011 2012 2013 2014...
I have inserted the formulas needed to calculate the income
statement. However I do not know how to enter the formulas for my
assumptions that are highlighted on the right.
May you please provide the formula to complete
the assumptions so I can understand what I am doing
I am trying to create a forecasted income statement in excel
from 2011 (original data) -through 2017 (forecasted data) . Can you
help me with this.
Net sales 2011 2012 2013 2014...
 Can this question please be answered?
1) Using the formulas in Table 4.1 and Urban Outfitters’s
financial statement starting on page 117, calculate the following
measures of financial performance. Be sure to report items (a)
through (e) in percentages (i.e., multiply your result x 100).
a. Gross profit margin
b. Operating profit margin
c. Net profit margin
d. Times-interest-earned (or coverage) ratio
e. Return on stockholders’ equity
f. Return on assets
g. Debt-to-equity ratio
h. Days of inventory
i. Inventory...
Can this question please be answered?
1) Using the formulas in Table 4.1 and Urban Outfitters’s
financial statement starting on page 117, calculate the following
measures of financial performance. Be sure to report items (a)
through (e) in percentages (i.e., multiply your result x 100).
a. Gross profit margin
b. Operating profit margin
c. Net profit margin
d. Times-interest-earned (or coverage) ratio
e. Return on stockholders’ equity
f. Return on assets
g. Debt-to-equity ratio
h. Days of inventory
i. Inventory...
 Excel assignment: Here are the instructions Please help with the
formulas needed thank you. #28-30 are missing in the excel
screenshot. They are
#28 Tax
#29 Net Income
#30 Cash Flow
Product Selling Prices: Oysters on half shell will sell for
$8.25 each (dozen) Fried Shrimp will sell for $10.25 (dozen)
Calamari will sell for $4.95 an order Catfish Sandwich will sell
for $5.95 Salads will sell for $4.50 each Fries sell for $1.25 per
order Sodas sell for $1.25...
Excel assignment: Here are the instructions Please help with the
formulas needed thank you. #28-30 are missing in the excel
screenshot. They are
#28 Tax
#29 Net Income
#30 Cash Flow
Product Selling Prices: Oysters on half shell will sell for
$8.25 each (dozen) Fried Shrimp will sell for $10.25 (dozen)
Calamari will sell for $4.95 an order Catfish Sandwich will sell
for $5.95 Salads will sell for $4.50 each Fries sell for $1.25 per
order Sodas sell for $1.25...
 please answer in excel format and provide formulas.
G E 84 C C Play Ode to Joy 2 Cick bere for a gcod time Sales for First Quarter 100% Sheetl Reatu Figure 5-28. Using the HYPERLINK function. COMPUTER EXERCISES We Love Plants, Inc. is a small company in the houseplant care business. People c for the company to come into their apartment or house to care for their plants when they a away on business or on vacation or all-year...
please answer in excel format and provide formulas.
G E 84 C C Play Ode to Joy 2 Cick bere for a gcod time Sales for First Quarter 100% Sheetl Reatu Figure 5-28. Using the HYPERLINK function. COMPUTER EXERCISES We Love Plants, Inc. is a small company in the houseplant care business. People c for the company to come into their apartment or house to care for their plants when they a away on business or on vacation or all-year...
 Instructions: By using the above information,
please calculate the ROA, show all work and your
interpretation.
[1] Return on Asset:
ROA = (net income) + ( 1 – tax rate)(interest exp) + minority
interest in earning / Average Total Assets
EXXON MOBIL CORPORATION CONDENSED CONSOLIDATED BALANCE SHEET (millions of dollars) Sept. 30, 2018 5,669 27,880 Assets Current assets Cash and cash equivalents Notes and accounts receivable -- net Inventories Crude oil, products and merchandise Materials and supplies Other current assets...
Instructions: By using the above information,
please calculate the ROA, show all work and your
interpretation.
[1] Return on Asset:
ROA = (net income) + ( 1 – tax rate)(interest exp) + minority
interest in earning / Average Total Assets
EXXON MOBIL CORPORATION CONDENSED CONSOLIDATED BALANCE SHEET (millions of dollars) Sept. 30, 2018 5,669 27,880 Assets Current assets Cash and cash equivalents Notes and accounts receivable -- net Inventories Crude oil, products and merchandise Materials and supplies Other current assets...
 PLEASE help! the paper are the instructions to fill in the
boxes in the excel sheet
eating a multiproduct profitability fthis project is to give the effects of changing business conditions on the The purposes can be used to deters will be to use Excel such a way that any changes to the Excel CVP Modeling project The purpose of this project is to give you experience creating a mi analysis that can be used to determine the effects of...
PLEASE help! the paper are the instructions to fill in the
boxes in the excel sheet
eating a multiproduct profitability fthis project is to give the effects of changing business conditions on the The purposes can be used to deters will be to use Excel such a way that any changes to the Excel CVP Modeling project The purpose of this project is to give you experience creating a mi analysis that can be used to determine the effects of...
 Please show the functions that are required as well as what to
enter into each function to get the correct output. excel is
preferred over hand written.
4 ABC Manufacturing expects to sell 1,025 units of product in 2019 at an average price of S100,000 per unit based on current demand The Chief Marketing Officer forecasts growth of 50 units per year through 2023. So, the demand will be 1,025 units in 2019, 1,075 units n 2020, etc. and the...
Please show the functions that are required as well as what to
enter into each function to get the correct output. excel is
preferred over hand written.
4 ABC Manufacturing expects to sell 1,025 units of product in 2019 at an average price of S100,000 per unit based on current demand The Chief Marketing Officer forecasts growth of 50 units per year through 2023. So, the demand will be 1,025 units in 2019, 1,075 units n 2020, etc. and the...
Most questions answered within 3 hours.
-
[Sales]
Assumes that I am a salesperson of a pharmaceutical firm. I am
trying to sell...
asked 2 minutes ago -
How many moles of carbon dioxide gas will occupy a volume of
6.25 L at 4.2atm...
asked 4 minutes ago -
Please help!!
Histidine is a polyprotic acid.
1. Draw a complete titration curve assuming 10.0 mL...
asked 19 minutes ago -
if total energy due two
electron is 1ev the distance between them is ?
asked 17 minutes ago -
You want to rent an unfurnished one-bedroom apartment in Boston
next year. The mean monthly rent...
asked 9 minutes ago -
In regression analysis: a. the independent variable must be
categorical in nature. b. the variables being...
asked 9 minutes ago -
Hello
I really dont understand how to work this probelem. A viewed
solution of how it...
asked 7 minutes ago -
How do I write a C program called binary that takes a single
command line argument,...
asked 19 minutes ago -
assume the salaries of elementary school teachers in the United
States normally distributed with a mean...
asked 23 minutes ago -
Question 10 - According to the Chapter Perspective, anti-hugging
policies have done which of the following?...
asked 25 minutes ago -
Research and explain how a hobby servo motor uses the pulse
width of the control signal...
asked 29 minutes ago -
To construct a solenoid, you wrap insulated wire uniformly
around a plastic tube 14 cm in...
asked 43 minutes ago