
Homework Answers
| income group | group members | population composition % | group income | income composition % |
| 1 | 350 | 43.75 | 2500 | 3.03 |
| 2 | 250 | 31.25 | 5000 | 6.06 |
| 3 | 150 | 18.75 | 15000 | 18.18 |
| 4 | 50 | 6.25 | 60000 | 72.72 |
| sum | 800 | 100 | 82500 | 100 |

The distribution of income is highly unequal. More than 90% of the population lives with less than 30% of the total income.
The lorenz curve is as shown in the diagram with cumulative percentage of population on X axis and cumulative percentage of income on the Y axis.
Coordinates are
A (43.75,3.03) ; B (75,9.09) ; C(93.75, 27.27)
Gini Index Calculation
Formula:  where
where 
The top income shares are held by income group 4. It accounts for 72.73% of the total income.
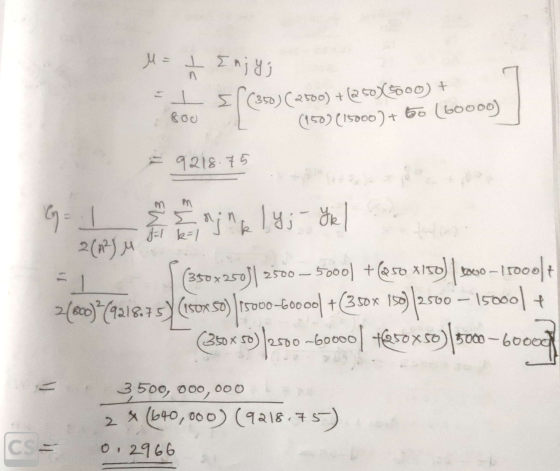
The gini index calculated is 0.2966
Add Answer to:
Analyze this distribution of income. Draw the Lorenz curve. Complete the Gini index. Calculate top income...
x-2 Find the Gini index of income concentration for the Lorenz curve with equation y =xe The Gini index isRoud to the nearest thousandth as needed.) x-2 Find the Gini index of income concentrati...
 x-2 Find the Gini index of income concentration for the Lorenz curve with equation y =xe The Gini index isRoud to the nearest thousandth as needed.)
x-2 Find the Gini index of income concentration for the Lorenz curve with equation y =xe The Gini index isRoud to the nearest thousandth as needed.)
x-2 Find the Gini index of income concentration for the Lorenz curve with equation y =xe The Gini index isRoud to the nearest thousandth as needed.)
3. The Gini Index Problem How is possible to measure the distribution of income among the inhabit...
 3. The Gini Index Problem How is possible to measure the distribution of income among the inhabitants of a given country One such measure is the Gini index, named after the Italian economist Corrado Gini, who first devised it in 1912. We first rank all households in a country by income and then we compute the percentage of households whose income is at most a given percentage of the country's total income. We define a Lorenz Curve y L(x) on...
Mars has an income distribution that can be modeled by the Lorenz Curve L(x)=x2.75 a. What...
Mars has an income distribution that can be modeled by the Lorenz Curve L(x)=x2.75 a. What percent of the wealth do the poorest 35% of Martians control? Round your answer to 2 decimal places b.What is Mars's Gini Index? Round your answer to 2 decimal places.
please ignore part1 ,need answers for part 2 Q5. Inequality Part I: Lorenz-Curve and Gini Coefficient...
 please ignore part1 ,need answers for part 2
Q5. Inequality Part I: Lorenz-Curve and Gini Coefficient Consider the following (very roughly measured) distribution of income in the economy Share of Households Cumulative Share of Income 0 Thus, the distribution function says that the lower half of the households carns one fourth of the total income in the society 1. Draw the Lorenz-curve for the economy 2 Calculate the Gini-coefficient. Part II: Redistributing Income Suppose that in an economy composed of...
please ignore part1 ,need answers for part 2
Q5. Inequality Part I: Lorenz-Curve and Gini Coefficient Consider the following (very roughly measured) distribution of income in the economy Share of Households Cumulative Share of Income 0 Thus, the distribution function says that the lower half of the households carns one fourth of the total income in the society 1. Draw the Lorenz-curve for the economy 2 Calculate the Gini-coefficient. Part II: Redistributing Income Suppose that in an economy composed of...
3. Constructing a Lorenz curve from personal income data The Smith quintuplets and the Johnson quintuplets...
 3. Constructing a Lorenz curve from personal income data The Smith quintuplets and the Johnson quintuplets grew up across the street from each other. Now in their 40s, the siblings earn the incomes shown in the following table: Smith Al Smith Bob Smith Chris Smith Dave Smith Ed Smith Total for Smiths Income (Dollars) 60,000 20,000 30,000 40,000 50,000 200,000 Johnson Karl Johnson Larry Johnson Moe Johnson Nate Johnson Oliver Johnson Total for Johnsons Income (Dollars) 10,000 30,000 70,000 50,000...
2. Gini Index Income Decile Income Share 0.05 0.1 0.15 0.2 0.25 0.35 un 0.45 1...
 2. Gini Index Income Decile Income Share 0.05 0.1 0.15 0.2 0.25 0.35 un 0.45 1 a. Graph the Lorenz Curve for the table above. (If it helps to be more precise than the table: the Lorenz curve has a slope of 0.05 from 0 to 0.5 of the income distribution, a slope of 0.1 from 0.5 to 0.8 on the income distribution, and a slope of 0.2 from 0.8 to 1 on the income distribution) b. Calculate the Gini...
Complete the following using the information from the Study Questions and Problems at the end of...
 Complete the following using the information from the
Study Questions and Problems at the end of Chapter 4, on pages 193
- 194, as indicated below:
Question 4.9 - Using the condensed financial
statements for Dragoon Enterprises that are provided on page 193,
you will need to provide information as follows:
(a) Dividends Dragoon paid.
(b) Information from the statement of cash flows using the
indirect method including:
1. Net cash provided (used) by operations.
2. Net cash provided (used)...
Complete the following using the information from the
Study Questions and Problems at the end of Chapter 4, on pages 193
- 194, as indicated below:
Question 4.9 - Using the condensed financial
statements for Dragoon Enterprises that are provided on page 193,
you will need to provide information as follows:
(a) Dividends Dragoon paid.
(b) Information from the statement of cash flows using the
indirect method including:
1. Net cash provided (used) by operations.
2. Net cash provided (used)...
I need help with the attached assignment. I attached the question and completed assigment. I just...
 I need help with the attached assignment. I attached the
question and completed assigment. I just need help with answering
one more question which is which is:
Discuss a strategy that you would use to communicate the status
of the project to stakeholders?
Project Monitoring and Control Assignment Complete the following items for this assignment: 1. Read through the Case 13.1 Tree Trimming Project Case in Larson and Gray. Respond to Questions 1 and 2 of the case. Use Microsoft...
I need help with the attached assignment. I attached the
question and completed assigment. I just need help with answering
one more question which is which is:
Discuss a strategy that you would use to communicate the status
of the project to stakeholders?
Project Monitoring and Control Assignment Complete the following items for this assignment: 1. Read through the Case 13.1 Tree Trimming Project Case in Larson and Gray. Respond to Questions 1 and 2 of the case. Use Microsoft...
My question is about the case study “ Comparing Apples and Oranges: which group yuelds the...
 My
question is about the case study “ Comparing Apples and Oranges:
which group yuelds the best profit?”
1) Using the Excel apreadsheet attached to complete the rooms
sold and revenue projections based on the above case study.
Case Study: "Comparing Apples and Oranges: Which Group Yields
the Best Profit?"
The Diamond Peak Hotel, one of 45 hotels in the Host Marriott
management company, was bustling with business this Thursday
afternoon as the hour of the daily revenue meeting drew...
My
question is about the case study “ Comparing Apples and Oranges:
which group yuelds the best profit?”
1) Using the Excel apreadsheet attached to complete the rooms
sold and revenue projections based on the above case study.
Case Study: "Comparing Apples and Oranges: Which Group Yields
the Best Profit?"
The Diamond Peak Hotel, one of 45 hotels in the Host Marriott
management company, was bustling with business this Thursday
afternoon as the hour of the daily revenue meeting drew...
1. Structural unemployment is the result of A) short-term movement of workers between jobs. B) job...
1. Structural unemployment is the result of A) short-term movement of workers between jobs. B) job search for first-time job seekers. C) technological change or permanent changes in industry demand. D) business cycle fluctuations. E) recurring changes in the hiring needs of certain industries. 2. The real interest rate equals A) the nominal interest rate minus the rate of unexpected inflation. B) the rate of expected inflation minus the nominal interest rate. C) the nominal interest rate minus the rate...
 x-2 Find the Gini index of income concentration for the Lorenz curve with equation y =xe The Gini index isRoud to the nearest thousandth as needed.)
x-2 Find the Gini index of income concentration for the Lorenz curve with equation y =xe The Gini index isRoud to the nearest thousandth as needed.)
x-2 Find the Gini index of income concentration for the Lorenz curve with equation y =xe The Gini index isRoud to the nearest thousandth as needed.)
 3. The Gini Index Problem How is possible to measure the distribution of income among the inhabitants of a given country One such measure is the Gini index, named after the Italian economist Corrado Gini, who first devised it in 1912. We first rank all households in a country by income and then we compute the percentage of households whose income is at most a given percentage of the country's total income. We define a Lorenz Curve y L(x) on...
 please ignore part1 ,need answers for part 2
Q5. Inequality Part I: Lorenz-Curve and Gini Coefficient Consider the following (very roughly measured) distribution of income in the economy Share of Households Cumulative Share of Income 0 Thus, the distribution function says that the lower half of the households carns one fourth of the total income in the society 1. Draw the Lorenz-curve for the economy 2 Calculate the Gini-coefficient. Part II: Redistributing Income Suppose that in an economy composed of...
please ignore part1 ,need answers for part 2
Q5. Inequality Part I: Lorenz-Curve and Gini Coefficient Consider the following (very roughly measured) distribution of income in the economy Share of Households Cumulative Share of Income 0 Thus, the distribution function says that the lower half of the households carns one fourth of the total income in the society 1. Draw the Lorenz-curve for the economy 2 Calculate the Gini-coefficient. Part II: Redistributing Income Suppose that in an economy composed of...
 3. Constructing a Lorenz curve from personal income data The Smith quintuplets and the Johnson quintuplets grew up across the street from each other. Now in their 40s, the siblings earn the incomes shown in the following table: Smith Al Smith Bob Smith Chris Smith Dave Smith Ed Smith Total for Smiths Income (Dollars) 60,000 20,000 30,000 40,000 50,000 200,000 Johnson Karl Johnson Larry Johnson Moe Johnson Nate Johnson Oliver Johnson Total for Johnsons Income (Dollars) 10,000 30,000 70,000 50,000...
 2. Gini Index Income Decile Income Share 0.05 0.1 0.15 0.2 0.25 0.35 un 0.45 1 a. Graph the Lorenz Curve for the table above. (If it helps to be more precise than the table: the Lorenz curve has a slope of 0.05 from 0 to 0.5 of the income distribution, a slope of 0.1 from 0.5 to 0.8 on the income distribution, and a slope of 0.2 from 0.8 to 1 on the income distribution) b. Calculate the Gini...
 Complete the following using the information from the
Study Questions and Problems at the end of Chapter 4, on pages 193
- 194, as indicated below:
Question 4.9 - Using the condensed financial
statements for Dragoon Enterprises that are provided on page 193,
you will need to provide information as follows:
(a) Dividends Dragoon paid.
(b) Information from the statement of cash flows using the
indirect method including:
1. Net cash provided (used) by operations.
2. Net cash provided (used)...
Complete the following using the information from the
Study Questions and Problems at the end of Chapter 4, on pages 193
- 194, as indicated below:
Question 4.9 - Using the condensed financial
statements for Dragoon Enterprises that are provided on page 193,
you will need to provide information as follows:
(a) Dividends Dragoon paid.
(b) Information from the statement of cash flows using the
indirect method including:
1. Net cash provided (used) by operations.
2. Net cash provided (used)...
 I need help with the attached assignment. I attached the
question and completed assigment. I just need help with answering
one more question which is which is:
Discuss a strategy that you would use to communicate the status
of the project to stakeholders?
Project Monitoring and Control Assignment Complete the following items for this assignment: 1. Read through the Case 13.1 Tree Trimming Project Case in Larson and Gray. Respond to Questions 1 and 2 of the case. Use Microsoft...
I need help with the attached assignment. I attached the
question and completed assigment. I just need help with answering
one more question which is which is:
Discuss a strategy that you would use to communicate the status
of the project to stakeholders?
Project Monitoring and Control Assignment Complete the following items for this assignment: 1. Read through the Case 13.1 Tree Trimming Project Case in Larson and Gray. Respond to Questions 1 and 2 of the case. Use Microsoft...
 My
question is about the case study “ Comparing Apples and Oranges:
which group yuelds the best profit?”
1) Using the Excel apreadsheet attached to complete the rooms
sold and revenue projections based on the above case study.
Case Study: "Comparing Apples and Oranges: Which Group Yields
the Best Profit?"
The Diamond Peak Hotel, one of 45 hotels in the Host Marriott
management company, was bustling with business this Thursday
afternoon as the hour of the daily revenue meeting drew...
My
question is about the case study “ Comparing Apples and Oranges:
which group yuelds the best profit?”
1) Using the Excel apreadsheet attached to complete the rooms
sold and revenue projections based on the above case study.
Case Study: "Comparing Apples and Oranges: Which Group Yields
the Best Profit?"
The Diamond Peak Hotel, one of 45 hotels in the Host Marriott
management company, was bustling with business this Thursday
afternoon as the hour of the daily revenue meeting drew...
Most questions answered within 3 hours.
-
A 6.5 cm diameter ball has a terminal speed of 22 m/s. What is
the ball's...
asked 36 seconds from now -
Name two areas of the human body with the highest concentration
of lymph nodes and speculate...
asked 3 minutes ago -
Angel Corporation has $10,000,000 of
8.0% 25 year bonds dated May 1, 2018 with interest payable...
asked 37 minutes ago -
7.
________ involves individuals trading goods they already have or
providing services in exchange for something...
asked 42 minutes ago -
Share your research problem. What databases did you search as
you gathered evidence to support your...
asked 42 minutes ago -
what process occurs to form microspores and megaspores in flowering
plants?
asked 49 minutes ago -
C++
I need to use the function getData to put in all my data using
arrays....
asked 48 minutes ago -
A block is hung by a string from the inside roof of a van. When
the...
asked 55 minutes ago -
Do you think companies should not go for long term debt in their
capital structure to...
asked 1 hour ago -
I create an address book where the user enters the name, phone
and email in the...
asked 1 hour ago -
The production capacity for acrylonitrile
(C3H3N) in the United States exceeds 2
million pounds per year....
asked 1 hour ago -
explain and comment out your answer
43. How many address lines are required to address a...
asked 1 hour ago