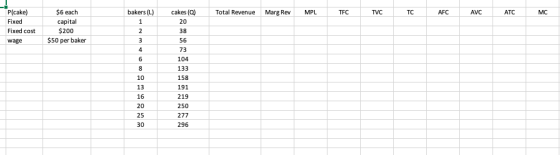
graph the short-run average cost curves.
explain how you got each. (total revenue, Marg rev, MPL, TFC, TVC, TC, AFC, AVC, ATC)
Homework Answers
| L | Q | TR($) = $6*Q | MR($)=∆TR/∆Q | MPL=∆Q/∆L | TFC($) | TVC($)=$50*L | TC($)=TFC+TVC | AFC($)=TFC/Q | AVC($)=TVC/Q | ATC($)=TC/Q | MC($)=∆TC/∆Q |
| 1 | 20 | 120.00 | 6 | 20 | 200 | 50 | 250 | 10.00 | 2.50 | 12.50 | 2.50 |
| 2 | 38 | 228.00 | 6 | 18.00 | 200 | 100 | 300 | 5.26 | 2.63 | 7.89 | 2.78 |
| 3 | 56 | 336.00 | 6 | 18.00 | 200 | 150 | 350 | 3.57 | 2.68 | 6.25 | 2.78 |
| 4 | 73 | 438.00 | 6 | 17.00 | 200 | 200 | 400 | 2.74 | 2.74 | 5.48 | 2.94 |
| 6 | 104 | 624.00 | 6 | 15.50 | 200 | 300 | 500 | 1.92 | 2.88 | 4.81 | 3.23 |
| 8 | 133 | 798.00 | 6 | 14.50 | 200 | 400 | 600 | 1.50 | 3.01 | 4.51 | 3.45 |
| 10 | 158 | 948.00 | 6 | 12.50 | 200 | 500 | 700 | 1.27 | 3.16 | 4.43 | 4.00 |
| 13 | 191 | 1146.00 | 6 | 11.00 | 200 | 650 | 850 | 1.05 | 3.40 | 4.45 | 4.55 |
| 16 | 219 | 1314.00 | 6 | 9.33 | 200 | 800 | 1000 | 0.91 | 3.65 | 4.57 | 5.36 |
| 20 | 250 | 1500.00 | 6 | 7.75 | 200 | 1000 | 1200 | 0.80 | 4.00 | 4.80 | 6.45 |
| 25 | 277 | 1662.00 | 6 | 5.40 | 200 | 1250 | 1450 | 0.72 | 4.51 | 5.23 | 9.26 |
| 30 | 296 | 1776.00 | 6 | 3.80 | 200 | 1500 | 1700 | 0.68 | 5.07 | 5.74 | 13.16 |
Add Answer to:
graph the short-run average cost curves.
explain how you got each. (total revenue, Marg rev, MPL,...
Calculate A) Total Fixed Cost (TFC), Total Variable Cost (TVC), Average Fixed Cost (AFC), Average Variable...
Calculate A) Total Fixed Cost (TFC), Total Variable Cost (TVC), Average Fixed Cost (AFC), Average Variable Cost (AVC), Average Total Cost (ATC), and Marginal Cost (MC). B) Graph the average fixed cost (AFC), average variable cost (AVC), average total cost (ATC), and the marginal cost (MC) curves on one graph and TFC curve, TVC cost curve, and TC curve on another graph. Quantity Produced Total Cost 0 $ 120 1 135 2 148 3 159 ...
(Production & Cost) The incomplete table below gives the total, average, and marginal cost curves for...
 (Production & Cost) The incomplete table below gives the total, average, and marginal cost curves for a firm. Use the cost function definitions to complete the table. Q TC TVC TFC MC ATC AVC AFC 10 17 2 339 7 15 12 6100 2
graph the short-run average cost curves and explain how you get this L M o P...
 graph the short-run average cost curves and explain how you get
this
L M o P Q R per unit cost 10 12 14 11 44 78 48 11.5 44 145 44 44 167 153 50 50 8.5 56 161 40 257 52.94 309.94 146 40 46 149 40 235 Labor Materials distribution variable overhead total 30 180 50 308 64.29 372.29 10.5 45 147 40 232 42.86 274.86 30 30 52 156 40 248 50 298 12.5 13.5 44...
graph the short-run average cost curves and explain how you get
this
L M o P Q R per unit cost 10 12 14 11 44 78 48 11.5 44 145 44 44 167 153 50 50 8.5 56 161 40 257 52.94 309.94 146 40 46 149 40 235 Labor Materials distribution variable overhead total 30 180 50 308 64.29 372.29 10.5 45 147 40 232 42.86 274.86 30 30 52 156 40 248 50 298 12.5 13.5 44...
How to calculate the Total Cost (TC), Average Fixed Cost (AFC), Average Total Cost (ATC), and...
 How to calculate the Total Cost (TC), Average Fixed Cost
(AFC), Average Total Cost (ATC), and Marginal Cost (MC)?
1. The schedule below gives the Total Variable Cost (TVC) for producing various quantities of smurfs (smurfs are an input into cat food production). The Total Fixed Costs (TFC) is $100. Calculate the following and fill in the blanks: Total Cost (TC), Average Fixed Cost (AFC), Average Variable Cost (AVC), Average Total Cost (ATC), and Marginal Cost (MC). Cost Schedule for...
How to calculate the Total Cost (TC), Average Fixed Cost
(AFC), Average Total Cost (ATC), and Marginal Cost (MC)?
1. The schedule below gives the Total Variable Cost (TVC) for producing various quantities of smurfs (smurfs are an input into cat food production). The Total Fixed Costs (TFC) is $100. Calculate the following and fill in the blanks: Total Cost (TC), Average Fixed Cost (AFC), Average Variable Cost (AVC), Average Total Cost (ATC), and Marginal Cost (MC). Cost Schedule for...
Complete the following short-run cost table using the information provided. Total product TFC AFC TVC AVC...
Complete the following short-run cost table using the information provided. Total product TFC AFC TVC AVC TC MC 0 0.0 1 3.0 2 5.0 5.0 3 9.0 7. (10 points) Answer the questions below on the basis of the above graph. (a) (3 points-1 point for short run; 1 point for long run; 1 point for how you can tell) How can you tell if these cost curves are for the short run or the long run? (b) (7 points)...
Each graph illustrates three short-run cost curves for firms, where ATC is average total cost (also...
 Each graph illustrates three short-run cost curves for firms, where ATC is average total cost (also referred to as average cost), MC is marginal cost, and AVC is average variable cost. Please classify each of the graphs as valid or invalid based on what you know about the relationships between these curves. Valid Invalid Answer Bank Graph A Graph F Graph E MC MC MC AVC AVC Cost Cost ATC ATC ATC AVC Output Output Output Graph C Graph D...
Each graph illustrates three short-run cost curves for firms, where ATC is average total cost (also...
 Each graph illustrates three short-run cost curves for firms, where ATC is average total cost (also referred to as average cost), MC is marginal cost, and AVC is average variable cost. Please classify each of the graphs as valid or invalid based on what you know about the relationships between these curves. Valid Invalid Graph D Output Graph E Graph Graph AVC Output Output
 (Production & Cost) The incomplete table below gives the total, average, and marginal cost curves for a firm. Use the cost function definitions to complete the table. Q TC TVC TFC MC ATC AVC AFC 10 17 2 339 7 15 12 6100 2
 graph the short-run average cost curves and explain how you get
this
L M o P Q R per unit cost 10 12 14 11 44 78 48 11.5 44 145 44 44 167 153 50 50 8.5 56 161 40 257 52.94 309.94 146 40 46 149 40 235 Labor Materials distribution variable overhead total 30 180 50 308 64.29 372.29 10.5 45 147 40 232 42.86 274.86 30 30 52 156 40 248 50 298 12.5 13.5 44...
graph the short-run average cost curves and explain how you get
this
L M o P Q R per unit cost 10 12 14 11 44 78 48 11.5 44 145 44 44 167 153 50 50 8.5 56 161 40 257 52.94 309.94 146 40 46 149 40 235 Labor Materials distribution variable overhead total 30 180 50 308 64.29 372.29 10.5 45 147 40 232 42.86 274.86 30 30 52 156 40 248 50 298 12.5 13.5 44...
 How to calculate the Total Cost (TC), Average Fixed Cost
(AFC), Average Total Cost (ATC), and Marginal Cost (MC)?
1. The schedule below gives the Total Variable Cost (TVC) for producing various quantities of smurfs (smurfs are an input into cat food production). The Total Fixed Costs (TFC) is $100. Calculate the following and fill in the blanks: Total Cost (TC), Average Fixed Cost (AFC), Average Variable Cost (AVC), Average Total Cost (ATC), and Marginal Cost (MC). Cost Schedule for...
How to calculate the Total Cost (TC), Average Fixed Cost
(AFC), Average Total Cost (ATC), and Marginal Cost (MC)?
1. The schedule below gives the Total Variable Cost (TVC) for producing various quantities of smurfs (smurfs are an input into cat food production). The Total Fixed Costs (TFC) is $100. Calculate the following and fill in the blanks: Total Cost (TC), Average Fixed Cost (AFC), Average Variable Cost (AVC), Average Total Cost (ATC), and Marginal Cost (MC). Cost Schedule for...
 Each graph illustrates three short-run cost curves for firms, where ATC is average total cost (also referred to as average cost), MC is marginal cost, and AVC is average variable cost. Please classify each of the graphs as valid or invalid based on what you know about the relationships between these curves. Valid Invalid Answer Bank Graph A Graph F Graph E MC MC MC AVC AVC Cost Cost ATC ATC ATC AVC Output Output Output Graph C Graph D...
 Each graph illustrates three short-run cost curves for firms, where ATC is average total cost (also referred to as average cost), MC is marginal cost, and AVC is average variable cost. Please classify each of the graphs as valid or invalid based on what you know about the relationships between these curves. Valid Invalid Graph D Output Graph E Graph Graph AVC Output Output
Most questions answered within 3 hours.
-
Why are polymers not typically casted into products?
asked 10 minutes ago -
When rolling a die 129 times, what is the probability of rolling
a 6 no more...
asked 27 minutes ago -
4. A call option currently sells for $7.75. It has a strike
price of $85 and...
asked 15 minutes ago -
1.
You need to prepare 10.0 liters of an acid aqueous solution with a
pH of...
asked 18 minutes ago -
Along an aggregate supply curve, if the level of output is less
than the natural level...
asked 19 minutes ago -
By 2025, annual consumption in emerging markets will total $30
trillion and contribute more than ________...
asked 24 minutes ago -
At what point does reformation cease to be a viable option for
those who are oppressed...
asked 28 minutes ago -
Place letters corresponding to amounts in the proper order for
lightest to heaviest samples:
a) 2100...
asked 32 minutes ago -
Consider the multicore processor with 6 heterogeneous cores
labelled C1, C2, C3, C4, C5, and C6....
asked 35 minutes ago -
Document system components according to standards and procedures
(Implement and hand over system components) IT administrative
asked 35 minutes ago -
The college asked 700 students if they wanted a longer spring
break and 600 students said...
asked 35 minutes ago -
Determine the temperature (in Celsius) at which 1.00 mole of an
ideal gas will have a...
asked 59 minutes ago