
Homework Answers
A negative externality in production shifts the supply curve to the left as shown below :
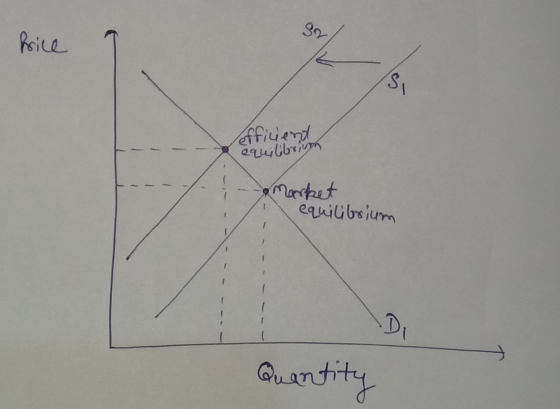
A higher than efficient quantity will be produced in the market as shown in the above figure.
Add Answer to:
Score: 7 of 8 pts x Question 7: Externalities and Economic Efficiency 21 Question Consider the...
I don't understand deadweight loss. I thought it was the surplus that was lost from a...
 I don't understand deadweight loss. I thought it was the surplus
that was lost from a shift. Why isn't the area I shaded red also
deadweight loss? It was originally producer surplus and it's now
above the demand curve, therefore it's no longer anyone's
surplus.
Consider the market illustrated in the figure to the right Supply curve S, represents the privats cost of production and demand curve D1 reprasents the private benefit from consumption Suppose the consumption of this good...
I don't understand deadweight loss. I thought it was the surplus
that was lost from a shift. Why isn't the area I shaded red also
deadweight loss? It was originally producer surplus and it's now
above the demand curve, therefore it's no longer anyone's
surplus.
Consider the market illustrated in the figure to the right Supply curve S, represents the privats cost of production and demand curve D1 reprasents the private benefit from consumption Suppose the consumption of this good...
3. The effect of negative externalities on the optimal quantity of consumption Consider the market for...
 3. The effect of negative externalities on the optimal quantity of consumption Consider the market for steel. Suppose that a steel manufacturing plant dumps toxic waste into a nearby river, creating a negative externality for those living downstream from the plant. Producing an additional ton of steel imposes a constant external cost of $385 per ton. The following graph shows the demand (private value) curve and the supply (private cost) curve for steel, Use the purple points (diamond symbol) to...
3. The effect of negative externalities on the optimal quantity of consumption Consider the market for...
 3. The effect of negative externalities on the optimal quantity of consumption Consider the market for paper. Suppose that a paper factory dumps toxic waste into a nearby river, creating a negative externality for those living downstream from the factory. Producing an additional ton of paper imposes a constant external cost of $150 per ton. The following graph shows the demand (private value) curve and the supply (private cost) curve for paper. Use the purple points (diamond symbol) to plot...
3. The effect of negative externalities on the optimal quantity of consumption Consider the market for...
 3. The effect of negative externalities on the optimal quantity of consumption Consider the market for steel. Suppose that a steel manufacturing plant dumps toxic waste into a nearby river, creating a negative externality for those living downstream from the plant. Producing an additional ton of steel imposes a constant external cost of $315 per ton. The following graph shows the demand (private value) curve and the supply (private cost) curve for steel. Use the purple points (diamond symbol) to...
3. The effect of negative externalities on the optimal quantityof consumption Consider the market for bolts....
 3. The effect of negative externalities on the optimal quantityof consumption Consider the market for bolts. Suppose that a hardware factory dumps toxic waste into a nearby river, creating a negative externality for those living downstream from the factory. Producing an additional ton of bolts imposes a constant external cost of $330 per ton. The following graph shows the demand (private value) curve and the supply (private cost) curve for bolts. Use the purple points (diamond symbol) to plot the...
Homework (Ch 10) 3. The effect of negative externalities on the optimal quantity of consumption Consider the market...
 Homework (Ch 10) 3. The effect of negative externalities on the optimal quantity of consumption Consider the market for bolts. Suppose that a hardware factory dumps toxic waste into a nearby river, creating a negative externality for those living downstream from the factory Producing an additional ton of bolts imposes a constant external cost of $140 per ton. The following graph shows the demand (private value) curve and the supply (private cost) curve for bolts. Use the purple points (diamond...
2. The effect of negative externalities on the optimal quantityof consumption Consider the market for steel....
 2. The effect of negative externalities on the optimal quantityof consumption Consider the market for steel. Suppose that a steel manufacturing plant dumps toxic waste into a nearby river, creating a negative externality for those living downstream from the plant. Producing an additional tonne of steel imposes a constant external cost of $165 per tonne. The following graph shows the demand (private value) curve and the supply (private cost) curve for steel. Use the purple points (diamond symbol) to plot...
3. The effect of negative externalities on the optimal quantity of consumption Consider the market for...
 3. The effect of negative externalities on the optimal quantity of consumption Consider the market for steel. Suppose that a steel manufacturing plant dumps toxic waste into a nearby river, creating a negative externality for those living downstream from the plant. Producing an additional ton of steel imposes a constant external cost of $60 per ton. The following graph shows the demand (private value) curve and the supply (private cost) curve for steel. Use the purple points (diamond symbol) to...
3. The effect of negative externalities on the optimal quantity of consumption Consider the market for...
 3. The effect of negative externalities on the optimal quantity of consumption Consider the market for steel. Suppose that a steel manufacturing plant dumps toxic waste into a nearby river, creating a negative externality for those living downstream from the plant. Producing an additional ton of steel imposes a constant external cost of $150 per ton. The following graph shows the demand (private value) curve and the supply (private cost) curve for steel. Use the purple points (diamond symbol) to...
ext Question 5.1 Question Help D. price of handbags New York City has licensed street vendors...
 ext Question 5.1 Question Help D. price of handbags New York City has licensed street vendors for more than a century. It Currently provides only a small number of general vending licenses. The waiting list is very long and, aside from military veterans, someone trying to get a license today has no chance. One popular item for street vendors is handbags. Use a supply-and-demand model to show how this licensing affects the market price and quantity of handbags sold by...
 I don't understand deadweight loss. I thought it was the surplus
that was lost from a shift. Why isn't the area I shaded red also
deadweight loss? It was originally producer surplus and it's now
above the demand curve, therefore it's no longer anyone's
surplus.
Consider the market illustrated in the figure to the right Supply curve S, represents the privats cost of production and demand curve D1 reprasents the private benefit from consumption Suppose the consumption of this good...
I don't understand deadweight loss. I thought it was the surplus
that was lost from a shift. Why isn't the area I shaded red also
deadweight loss? It was originally producer surplus and it's now
above the demand curve, therefore it's no longer anyone's
surplus.
Consider the market illustrated in the figure to the right Supply curve S, represents the privats cost of production and demand curve D1 reprasents the private benefit from consumption Suppose the consumption of this good...
 3. The effect of negative externalities on the optimal quantity of consumption Consider the market for steel. Suppose that a steel manufacturing plant dumps toxic waste into a nearby river, creating a negative externality for those living downstream from the plant. Producing an additional ton of steel imposes a constant external cost of $385 per ton. The following graph shows the demand (private value) curve and the supply (private cost) curve for steel, Use the purple points (diamond symbol) to...
 3. The effect of negative externalities on the optimal quantity of consumption Consider the market for paper. Suppose that a paper factory dumps toxic waste into a nearby river, creating a negative externality for those living downstream from the factory. Producing an additional ton of paper imposes a constant external cost of $150 per ton. The following graph shows the demand (private value) curve and the supply (private cost) curve for paper. Use the purple points (diamond symbol) to plot...
 3. The effect of negative externalities on the optimal quantity of consumption Consider the market for steel. Suppose that a steel manufacturing plant dumps toxic waste into a nearby river, creating a negative externality for those living downstream from the plant. Producing an additional ton of steel imposes a constant external cost of $315 per ton. The following graph shows the demand (private value) curve and the supply (private cost) curve for steel. Use the purple points (diamond symbol) to...
 3. The effect of negative externalities on the optimal quantityof consumption Consider the market for bolts. Suppose that a hardware factory dumps toxic waste into a nearby river, creating a negative externality for those living downstream from the factory. Producing an additional ton of bolts imposes a constant external cost of $330 per ton. The following graph shows the demand (private value) curve and the supply (private cost) curve for bolts. Use the purple points (diamond symbol) to plot the...
 Homework (Ch 10) 3. The effect of negative externalities on the optimal quantity of consumption Consider the market for bolts. Suppose that a hardware factory dumps toxic waste into a nearby river, creating a negative externality for those living downstream from the factory Producing an additional ton of bolts imposes a constant external cost of $140 per ton. The following graph shows the demand (private value) curve and the supply (private cost) curve for bolts. Use the purple points (diamond...
 2. The effect of negative externalities on the optimal quantityof consumption Consider the market for steel. Suppose that a steel manufacturing plant dumps toxic waste into a nearby river, creating a negative externality for those living downstream from the plant. Producing an additional tonne of steel imposes a constant external cost of $165 per tonne. The following graph shows the demand (private value) curve and the supply (private cost) curve for steel. Use the purple points (diamond symbol) to plot...
 3. The effect of negative externalities on the optimal quantity of consumption Consider the market for steel. Suppose that a steel manufacturing plant dumps toxic waste into a nearby river, creating a negative externality for those living downstream from the plant. Producing an additional ton of steel imposes a constant external cost of $60 per ton. The following graph shows the demand (private value) curve and the supply (private cost) curve for steel. Use the purple points (diamond symbol) to...
 3. The effect of negative externalities on the optimal quantity of consumption Consider the market for steel. Suppose that a steel manufacturing plant dumps toxic waste into a nearby river, creating a negative externality for those living downstream from the plant. Producing an additional ton of steel imposes a constant external cost of $150 per ton. The following graph shows the demand (private value) curve and the supply (private cost) curve for steel. Use the purple points (diamond symbol) to...
 ext Question 5.1 Question Help D. price of handbags New York City has licensed street vendors for more than a century. It Currently provides only a small number of general vending licenses. The waiting list is very long and, aside from military veterans, someone trying to get a license today has no chance. One popular item for street vendors is handbags. Use a supply-and-demand model to show how this licensing affects the market price and quantity of handbags sold by...
Most questions answered within 3 hours.
-
Buses are powered by chemical reactions. Define matter and the
four states of matter. What is...
asked 12 minutes ago -
Use conservation of energy to find the velocity of a free point
charge q1 at 22cm...
asked 20 minutes ago -
First, describe policies promoted by governments of the
political right to address economic globalization. Second, describe...
asked 37 minutes ago -
M2-9 Completing T-Accounts LO2-4
Following are the transactions of Dennen, Inc., for the month of
January....
asked 37 minutes ago -
Write a program using python that reads from values from a text
file and plots them...
asked 38 minutes ago -
Look up the density of
the metal of the object used in parts A and B...
asked 37 minutes ago -
Discuss strategic considerations that Amazon and NYC politicians
had. Analyze why the deal between Amazon and...
asked 41 minutes ago -
A combustion reaction is describes as a carbon source reacting
with oxygen and producing carbon dioxide...
asked 56 minutes ago -
Buckminsterfullerence is a recently allotrope of carbon in which
carbon atoms form molecules of formula C_60,...
asked 58 minutes ago -
Lower Equitorial and Upper Equitorial are the same except Lower
Equitorial has a larger capital stock....
asked 1 hour ago -
how do you think that pH of a jar where you have added a certain
amount...
asked 1 hour ago -
If the Federal Reserve increases the reserve requirement, what
will happen to the Money Supply in...
asked 1 hour ago