

Homework Answers
(a)
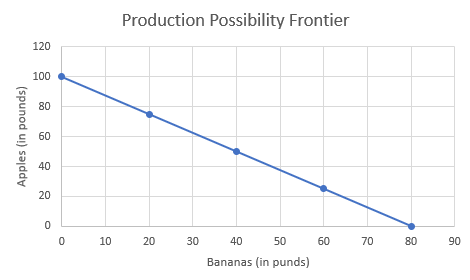
(b) The economy above does not demonstrate the law of increasing opportunity cost. Since the production possibility frontier is linear, the opportunity cost of each unit of apples in terms of banana remains same at all levels. However, the law of increasing opportunity cost holds for a concave production possibility curve. Hence, the answer is NO.
(c) To produce 100 pounds of apples, 80 pounds of banana needs to be given up. So, for 1 pound of apple, 80/100 = 0.8 pounds of apple needs to be sacrificed. Hence, opportunity cost of a pound of apple = 0.8 pounds of apples.
To produce 80 pounds of bananas, 100 pounds of apples need to be sacrificed. So, for 1 pound of banana, 100/80 = 1.25 pounds of bananas need to be sacrificed. Hence, opportunity cost of a pound of bananas = 1.25 pounds of apples.
Add Answer to:
ECON 2303 HW I SP 20 A production possibilities table for bananas and apples is shown...
Saved r 1- Homework A production possibilities table for bananas and apples is shown below: Production...
 Saved r 1- Homework A production possibilities table for bananas and apples is shown below: Production Alternatives Type of Production A Bananas (in pounds) 0 204060 Apples (in pounds) 100 75 5025 80 a. Show these data graphically. Instructions: Use the tool provided 'PPC' to draw a PPC curve (plot 5 points total. Tools 125 PPC 100
A production possibilities table for DVDs and computers is shown below. Point (Click to select) G F D B C A is an example...
 A production possibilities table for DVDs and computers is shown
below.
Point (Click to
select) G F D B C A is
an example of an inefficient point, while (Click to
select) G B A D F C is
an example of an unattainable point.
b. Does the economy above demonstrate the law of increasing
opportunity cost?
(Click to
select) Yes No
Production Alternatives Type of Production A Computers DVDs 20 60 80 80 70 35 a. Show these data graphically, and then identify a point that indicates an inefficient use of resources and a point that indicates...
A production possibilities table for DVDs and computers is shown
below.
Point (Click to
select) G F D B C A is
an example of an inefficient point, while (Click to
select) G B A D F C is
an example of an unattainable point.
b. Does the economy above demonstrate the law of increasing
opportunity cost?
(Click to
select) Yes No
Production Alternatives Type of Production A Computers DVDs 20 60 80 80 70 35 a. Show these data graphically, and then identify a point that indicates an inefficient use of resources and a point that indicates...
1- Homewórk Saved A production possibilities table for DVDs and computers is shown below. Production Alternatives...
 1- Homewórk Saved A production possibilities table for DVDs and computers is shown below. Production Alternatives Type of Production A Computers DVDs 20 40 60 55 35 2 80 80 esa. Show these data graphically. Instructions: Use the tool provided 'PPC' to draw a PPC curve (plot 5 points total). Tools 100 90 80 70 PPC Computers b. What is the opportunity cost of the first 20 computers? (Cick to select c. Between which two consecutive points along the PPC...
A production possibilities table for DVDs and computers is shown below Production Alternatives Type of Production...
 A production possibilities table for DVDs and computers is shown below Production Alternatives Type of Production A Computers DVDs 0 20 40 60 80 80 70 35 a. Show these data graphically, and then identify a point that indicates an inefficient use of resources and a point that indicates an unattainable combination of goods Instructions: Use the tool provided 'PPC to draw a PPC curve (plot 5 points total) b. Does the economy above demonstrate the law of increasing opportunity cost?
it asks to plot 4 points each please help The accompanying hypothetical production possibilities tables are...
 it asks to plot 4 points each please help
The accompanying hypothetical production possibilities tables are for New Zealand and Spain. Each country can produce apples and plums. New Zealand's Production Possibilities Table M4lions of Bushels Production Alternatives Product A B с D Apples @ 23 40 60 Pluns 15 10 15 Spain's Production Possibilities Table (Millions of Bushels) Production Alternatives Product R s T U Apples @ 20 40 60 Plums 60 40 20 a plot the production possibile...
it asks to plot 4 points each please help
The accompanying hypothetical production possibilities tables are for New Zealand and Spain. Each country can produce apples and plums. New Zealand's Production Possibilities Table M4lions of Bushels Production Alternatives Product A B с D Apples @ 23 40 60 Pluns 15 10 15 Spain's Production Possibilities Table (Millions of Bushels) Production Alternatives Product R s T U Apples @ 20 40 60 Plums 60 40 20 a plot the production possibile...
Question 17 1 pts On a production possibilities frontier, 500 pounds of apples and 1,200 pounds...
 Question 17 1 pts On a production possibilities frontier, 500 pounds of apples and 1,200 pounds of bananas can be produced while at another point on the same frontier, 300 pounds of apples and 1,300 pounds of bananas can be produced. Between these points, what is the opportunity cost of producing a pound of bananas? 2 pounds of apples 2 pounds of bananas 200 pounds of apples 0.5 a pound of apples 1 pts Question 18
Use the following table to answer the question below. Dave's Production Possibilities Schedule Pounds of Green...
 Use the following table to answer the question below. Dave's Production Possibilities Schedule Pounds of Green Beans Pounds of Corn 160 20 120 40 80 60 40 80 Simon's Production Possibilities Schedule Pounds of Green Beans Pounds of Corn 80 40 60 89 40 120 20 160 @ Dave's opportunity cost of producing 1 pound of corn is pound(s) of green beans. pound(s) of green beans. Simon's opportunity cost of producing 1 pound of com is Multiple Choice 1,2 2.12...
able Production Possibilities Schedule I) Use Table: Production Possibilities Schedule I. The opportunity cost of producing...
 able Production Possibilities Schedule I) Use Table: Production Possibilities Schedule I. The opportunity cost of producing the third unit of consumer goods is units of capital goods. Table: Production Possibilities Schedule I Alternatives Consumer goods per period 0 Capital goods per period 30 28 24 1810 8 2 (Figure: Comparative Advantage) Use Figure: Comparative Advantage. Westland has a comparative advantage in producing: Figure: Comparative Advantage Eastland and Westland produce only two goods, boxes of peaches and boxes of oranges, and...
Instructions: For the following questions, use the diagram of production possibilities for the United States a....
 Instructions: For the following questions, use the diagram of production possibilities for the United States a. Which point, A or B, best represents the combination of present and future goods in the United States? (Click to select) b. W ook int hich production possibilities curve best represents future growth in the United States? (Click to select) Instructions: For the following questions, use the diagram of production possibilities in China. c. Which point, A or B, best represents the combination of...
A production possibilities table for DVDs and computers is shown below.
A production possibilities table for DVDs and computers is shown below. Production AlternativesType of ProductionABCDEComputers020406080DVDs806547270Instructions: Enter your answers as absolute and whole numbers. a. What is the opportunity cost of computers when moving from point A to point B? b. What is the opportunity cost of computers when moving from point B to point C? c. What is the opportunity cost of computers when moving from point C to point D?
 Saved r 1- Homework A production possibilities table for bananas and apples is shown below: Production Alternatives Type of Production A Bananas (in pounds) 0 204060 Apples (in pounds) 100 75 5025 80 a. Show these data graphically. Instructions: Use the tool provided 'PPC' to draw a PPC curve (plot 5 points total. Tools 125 PPC 100
 A production possibilities table for DVDs and computers is shown
below.
Point (Click to
select) G F D B C A is
an example of an inefficient point, while (Click to
select) G B A D F C is
an example of an unattainable point.
b. Does the economy above demonstrate the law of increasing
opportunity cost?
(Click to
select) Yes No
Production Alternatives Type of Production A Computers DVDs 20 60 80 80 70 35 a. Show these data graphically, and then identify a point that indicates an inefficient use of resources and a point that indicates...
A production possibilities table for DVDs and computers is shown
below.
Point (Click to
select) G F D B C A is
an example of an inefficient point, while (Click to
select) G B A D F C is
an example of an unattainable point.
b. Does the economy above demonstrate the law of increasing
opportunity cost?
(Click to
select) Yes No
Production Alternatives Type of Production A Computers DVDs 20 60 80 80 70 35 a. Show these data graphically, and then identify a point that indicates an inefficient use of resources and a point that indicates...
 1- Homewórk Saved A production possibilities table for DVDs and computers is shown below. Production Alternatives Type of Production A Computers DVDs 20 40 60 55 35 2 80 80 esa. Show these data graphically. Instructions: Use the tool provided 'PPC' to draw a PPC curve (plot 5 points total). Tools 100 90 80 70 PPC Computers b. What is the opportunity cost of the first 20 computers? (Cick to select c. Between which two consecutive points along the PPC...
 A production possibilities table for DVDs and computers is shown below Production Alternatives Type of Production A Computers DVDs 0 20 40 60 80 80 70 35 a. Show these data graphically, and then identify a point that indicates an inefficient use of resources and a point that indicates an unattainable combination of goods Instructions: Use the tool provided 'PPC to draw a PPC curve (plot 5 points total) b. Does the economy above demonstrate the law of increasing opportunity cost?
 it asks to plot 4 points each please help
The accompanying hypothetical production possibilities tables are for New Zealand and Spain. Each country can produce apples and plums. New Zealand's Production Possibilities Table M4lions of Bushels Production Alternatives Product A B с D Apples @ 23 40 60 Pluns 15 10 15 Spain's Production Possibilities Table (Millions of Bushels) Production Alternatives Product R s T U Apples @ 20 40 60 Plums 60 40 20 a plot the production possibile...
it asks to plot 4 points each please help
The accompanying hypothetical production possibilities tables are for New Zealand and Spain. Each country can produce apples and plums. New Zealand's Production Possibilities Table M4lions of Bushels Production Alternatives Product A B с D Apples @ 23 40 60 Pluns 15 10 15 Spain's Production Possibilities Table (Millions of Bushels) Production Alternatives Product R s T U Apples @ 20 40 60 Plums 60 40 20 a plot the production possibile...
 Question 17 1 pts On a production possibilities frontier, 500 pounds of apples and 1,200 pounds of bananas can be produced while at another point on the same frontier, 300 pounds of apples and 1,300 pounds of bananas can be produced. Between these points, what is the opportunity cost of producing a pound of bananas? 2 pounds of apples 2 pounds of bananas 200 pounds of apples 0.5 a pound of apples 1 pts Question 18
 Use the following table to answer the question below. Dave's Production Possibilities Schedule Pounds of Green Beans Pounds of Corn 160 20 120 40 80 60 40 80 Simon's Production Possibilities Schedule Pounds of Green Beans Pounds of Corn 80 40 60 89 40 120 20 160 @ Dave's opportunity cost of producing 1 pound of corn is pound(s) of green beans. pound(s) of green beans. Simon's opportunity cost of producing 1 pound of com is Multiple Choice 1,2 2.12...
 able Production Possibilities Schedule I) Use Table: Production Possibilities Schedule I. The opportunity cost of producing the third unit of consumer goods is units of capital goods. Table: Production Possibilities Schedule I Alternatives Consumer goods per period 0 Capital goods per period 30 28 24 1810 8 2 (Figure: Comparative Advantage) Use Figure: Comparative Advantage. Westland has a comparative advantage in producing: Figure: Comparative Advantage Eastland and Westland produce only two goods, boxes of peaches and boxes of oranges, and...
 Instructions: For the following questions, use the diagram of production possibilities for the United States a. Which point, A or B, best represents the combination of present and future goods in the United States? (Click to select) b. W ook int hich production possibilities curve best represents future growth in the United States? (Click to select) Instructions: For the following questions, use the diagram of production possibilities in China. c. Which point, A or B, best represents the combination of...
Most questions answered within 3 hours.
-
While rotating the tires on your car you notice a rock [mass =
0.1 Kg] stuck...
asked 1 hour ago -
Using MARS simulator, write MIPS programs according to
the following scenarios: Receive a positive integer number...
asked 2 hours ago -
An object in front of a concave mirror has a real image that is
11.5 cm...
asked 3 hours ago -
Consider the reaction, C3 H8 + O2 --> CO2 + H2O. How many
moles of O2...
asked 4 hours ago -
You and your opponent both roll a fair die. If you both roll the
same number,...
asked 5 hours ago -
In a study of the accuracy of fast food drive-through orders,
Restaurant A had 257 accurate...
asked 5 hours ago -
Identify and describe in detail the four categories of
institutions that could be included in a...
asked 5 hours ago -
In python
class Customer:
def __init__(self, customer_id, last_name, first_name, phone_number, address):
self._customer_id = int(customer_id)
self._last_name =...
asked 5 hours ago -
What is an example of a limitation in implementing a new
ERP system and how it...
asked 5 hours ago -
In a section of 9.7cm of an artery with a radius of 2.6mm there
is a...
asked 5 hours ago -
the two carboxylic acid groups of aspartic acid have different
acidities with pKa values of 2.1...
asked 5 hours ago -
Would CuCO3 aqueous salt combined with calcium chloride
form a solid precipitate? If so, what would...
asked 5 hours ago