Assume there are no investment projects in the economy that yield an expected rate of return of 25 percent or more. But suppose there are $10 billion of investment projects yielding expected returns of at least 20 percent; another $10 billion yielding at least 15 percent; another $10 billion yielding at least 10 percent; and so forth.


Homework Answers
(a)
| Expected rate of return (%) | Cummulative Investment ($ billion) |
| 25 | 0 |
| 20 | 10 |
| 15 | 20 |
| 10 | 30 |
| 5 | 40 |
| 0 | 50 |
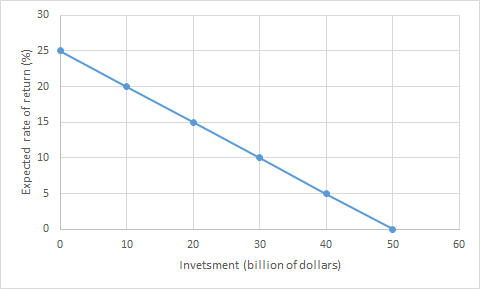
(b) Equilibrium level of aggregate investment if the real rate of interest is 15 percent.
Answer: $20 billion.
Equilibrium level of aggregate investment if the real rate of interest is 10 percent.
Answer: $30 billion.
Equilibrium level of aggregate investment if the real rate of interest is 5 percent.
Answer: $40 billion.
Add Answer to:
Assume there are no investment projects in the economy that
yield an expected rate of return...
Assume there are no investment projects in the economy that yield an expected rate of return...
 Assume there are no investment projects in the economy that yield an expected rate of return of 25 percent or more. But suppose there are $10 billion of investment projects yielding expected returns of at least 20 percent; another $10 billion yielding at least 15 percent; another $10 billion yielding at least 10 percent, and so forth a. Draw this relationship between the expected rate of return and the amount of investment expenditure Instructions: Use the tool provided 'ID' to...
Assume there are no investment projects that will produce an expected rate of return of 8...
Assume there are no investment projects that will produce an expected rate of return of 8 percent or more. There are, however, $2 billion worth of investment projects with an expected rate of return at 7 percent, an additional $2 billion for every drop of the interest rate by 1 percent. If the real interest rate is 3 percent in this economy, the cumulative amount of investment at the 3 percent or higher rate of return is: A. $10 billion...
Draw a planned aggregate expenditure curve for an economy where autonomous expenditure is $200 billion and...
 Draw a planned aggregate expenditure curve for an economy where autonomous expenditure is $200 billion and the marginal propensity to consume is equal to 0.50. Plot values for Actual Aggregate Expenditure' of $100, $200, $300, $400, $500, and $600. Instructions: Use the graphing tool to draw the planned aggregate expenditure curve by plotting points at each level of output (Y) starting with zero and ending with 500. Planned Aggregate Expenditure (PAE, billions of dollars) PAE = Y 500 Tools 450...
The aggregate investment demand curve is depicted in the graph below. Investment Demand Interest Rate (percent)...
 The aggregate investment demand curve is depicted in the graph below. Investment Demand Interest Rate (percent) 10% ☺ => 1 2 3 4 5 6 7 8 Investment (thousands of dollars) Suppose the real interest rate is 6%. Draw the investment schedule that shows the relationship between the level of real GDP and investment Instructions: Use the tool provided I to plot only the endpoints such that the first point touches the vertical axis. Aggregate Expenditures Aggregate Expenditures (dollars) 10,000...
Assume that for the entire business sector of the economy there is $5 worth of investment...
 Assume that for the entire business sector of the economy there is $5 worth of investment projects which will yield an expected rate of return of 25 percent or more. But there are $7 worth of investments which will yield an expected rate of return of 20-25 percent; another $15 with an expected rate of return of 15-20 percent; and similarly an additional $22 of investment projects in each successive rate of return range down to an including the 0-5...
Assume that for the entire business sector of the economy there is $0 worth of investment...
 Assume that for the entire business sector of the economy there is $0 worth of investment projects which will yield an expected rate of return of 25 percent or more. But there are $7 worth of investments which will yield an expected rate of return of 20-25 percent; another $16 with an expected rate of return of 15-20 percent; and similarly an additional $23 of investment projects in each successive rate of return range down to an including the 0-5...
Investment demand and the market for money are shown in the graphs below. If the economy...
 Investment demand and the market for money are shown in the graphs below. If the economy has a recessionary gap of $100 billion and the MPC is 0.8, what level of the money supply should the central bank target if it wants to bring real GDP back to the full- employment level? Demonstrate your answer graphically. Instructions: Use the tool provided 'Sm2' to draw the new money supply curve. Use the graph on the right to plot your line such...
Assume that, without taxes, the consumption schedule of an economy is as follows GDP, Billions Consumption,...
 Assume that, without taxes, the consumption schedule of an economy is as follows GDP, Billions Consumption, Billions $0 100 200 300 $40 120 200 280 360 440 520 600 400 500 600 700 a. What is the value of the MPC? Graph the resulting consumption schedule. Instructions: Use the tool provided "CE to draw the consumption schedule (plot 8 points total). Consumption Expenditure Tools CE Consumption (billions of dollars) 45 100 200 300 400 500 600 700 800 Help Save...
G ov ernment Consumption Real GDP, Y (billions of 2005 dollars) Investment, I (billions of expenditure,...
 G ov ernment Consumption Real GDP, Y (billions of 2005 dollars) Investment, I (billions of expenditure, G (billions of expenditure, C lions of (bil 2005 dollars) 2005 dollars) 2005 dollars) 20 25 30 35 10 14 18 tion. When real GDP is $15 billion, fims inventories experience an unplanned Real (bill 2005 The above table contains information about the nation of Syldavia There are no income taxes or imports in this nation. When real GDP is O A. decrease of...
The following table shows the investment choices and expected rate of return facing a hypothetical firm....
 The following table shows the investment choices and expected rate of return facing a hypothetical firm. Total Investment Estimated Rate of Project (Millions of Dollars) Return (%) Factory in lowa 17 12 Factory in Wyoming 13 14 Company plane 8 12 Outlet store 4 18 Computer network 3 19 New cafeteria 2 6 At an interest rate of 16 percent, this firm will undertake $ 1 million worth of investment spending. (Enter your response as an integer) The firm will...
 Assume there are no investment projects in the economy that yield an expected rate of return of 25 percent or more. But suppose there are $10 billion of investment projects yielding expected returns of at least 20 percent; another $10 billion yielding at least 15 percent; another $10 billion yielding at least 10 percent, and so forth a. Draw this relationship between the expected rate of return and the amount of investment expenditure Instructions: Use the tool provided 'ID' to...
 Draw a planned aggregate expenditure curve for an economy where autonomous expenditure is $200 billion and the marginal propensity to consume is equal to 0.50. Plot values for Actual Aggregate Expenditure' of $100, $200, $300, $400, $500, and $600. Instructions: Use the graphing tool to draw the planned aggregate expenditure curve by plotting points at each level of output (Y) starting with zero and ending with 500. Planned Aggregate Expenditure (PAE, billions of dollars) PAE = Y 500 Tools 450...
 The aggregate investment demand curve is depicted in the graph below. Investment Demand Interest Rate (percent) 10% ☺ => 1 2 3 4 5 6 7 8 Investment (thousands of dollars) Suppose the real interest rate is 6%. Draw the investment schedule that shows the relationship between the level of real GDP and investment Instructions: Use the tool provided I to plot only the endpoints such that the first point touches the vertical axis. Aggregate Expenditures Aggregate Expenditures (dollars) 10,000...
 Assume that for the entire business sector of the economy there is $5 worth of investment projects which will yield an expected rate of return of 25 percent or more. But there are $7 worth of investments which will yield an expected rate of return of 20-25 percent; another $15 with an expected rate of return of 15-20 percent; and similarly an additional $22 of investment projects in each successive rate of return range down to an including the 0-5...
 Assume that for the entire business sector of the economy there is $0 worth of investment projects which will yield an expected rate of return of 25 percent or more. But there are $7 worth of investments which will yield an expected rate of return of 20-25 percent; another $16 with an expected rate of return of 15-20 percent; and similarly an additional $23 of investment projects in each successive rate of return range down to an including the 0-5...
 Investment demand and the market for money are shown in the graphs below. If the economy has a recessionary gap of $100 billion and the MPC is 0.8, what level of the money supply should the central bank target if it wants to bring real GDP back to the full- employment level? Demonstrate your answer graphically. Instructions: Use the tool provided 'Sm2' to draw the new money supply curve. Use the graph on the right to plot your line such...
 Assume that, without taxes, the consumption schedule of an economy is as follows GDP, Billions Consumption, Billions $0 100 200 300 $40 120 200 280 360 440 520 600 400 500 600 700 a. What is the value of the MPC? Graph the resulting consumption schedule. Instructions: Use the tool provided "CE to draw the consumption schedule (plot 8 points total). Consumption Expenditure Tools CE Consumption (billions of dollars) 45 100 200 300 400 500 600 700 800 Help Save...
 G ov ernment Consumption Real GDP, Y (billions of 2005 dollars) Investment, I (billions of expenditure, G (billions of expenditure, C lions of (bil 2005 dollars) 2005 dollars) 2005 dollars) 20 25 30 35 10 14 18 tion. When real GDP is $15 billion, fims inventories experience an unplanned Real (bill 2005 The above table contains information about the nation of Syldavia There are no income taxes or imports in this nation. When real GDP is O A. decrease of...
 The following table shows the investment choices and expected rate of return facing a hypothetical firm. Total Investment Estimated Rate of Project (Millions of Dollars) Return (%) Factory in lowa 17 12 Factory in Wyoming 13 14 Company plane 8 12 Outlet store 4 18 Computer network 3 19 New cafeteria 2 6 At an interest rate of 16 percent, this firm will undertake $ 1 million worth of investment spending. (Enter your response as an integer) The firm will...
Most questions answered within 3 hours.
-
Company AAA produces only one product which other manufacturers
purchase as a component for their final...
asked 1 hour ago -
An
item can be appended to an array-based list, provided the lenght is
less than the...
asked 1 hour ago -
Two particles each have a rest mass energy of 30 MeV and are
traveling with a...
asked 3 hours ago -
why
is vectorization a faster alternative to loops?
asked 4 hours ago -
General Matter’s outstanding bond issue has a coupon rate of
11.8%, and it sells at a...
asked 4 hours ago -
Write a one page essay on how important is it to know your basic
accounting knowledge...
asked 4 hours ago -
You are a Senior Civil Engineer posted at the Contracts and
Procurement Division of the Ministry...
asked 5 hours ago -
When using the percentage of completion method, the
company
- recognizes revenues and gross profit each...
asked 5 hours ago -
Is a level production strategy suitable for a pure service
industry, such as professional accounting and...
asked 5 hours ago -
Baker Industries’ net income is $23000, its interest expense is
$4000, and its tax rate is...
asked 5 hours ago -
a) A proton moves at 500 m/s in a 2 T magnetic field. What is
the...
asked 5 hours ago -
Anderson Systems is considering a project that has the following
cash flow and WACC data. What...
asked 6 hours ago