Please chose the right answer and explain why. Thank you so much!


Homework Answers
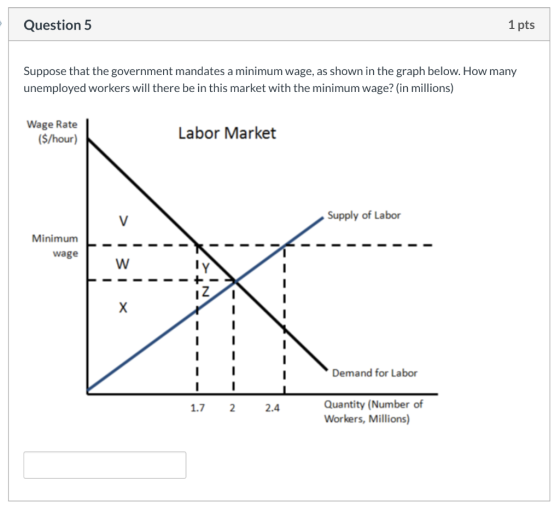
Answer : 5) The answer is 0.7 million.
Because at minimum wage rate the labour demanded = 1.7 million and labor supplied = 2.4 million. So, unemployed people = Labor supplied - Labor demanded = 2.4 - 1.7 = 0.7 million.
6) The answer is option D : Ptax - P1 .
Based on given diagram, after tax consumers pays Ptax price level but producers receives P1 price level. So, per unit tax = Consumers' paid price - Producers' received price = Ptax - P1 . Hence except option D other options are not correct. Therefore, option D is the correct answer.
7) The answer is option B.
If tax is imposed on a good then the price of that good increase. With this high price level quantity demanded decrease hence the quantity sold decrease. Hence except option B other options are not correct. Therefore, option B is the correct answer.
Add Answer to:
Please chose the right answer and explain why. Thank you so
much!
Question 5 1 pts...
Please chose the right answer and explain why. Thank you Question 1 1 pts In the...
 Please chose the right answer and explain why. Thank you
Question 1 1 pts In the graph below, what area represents the producer surplus received by workers in the unregulated labor market? Wage Rate ($/hour) Labor Market Supply of Labor Minimum wage X TEL< KIN Demand for Labor 1.7 2 2.4 Quantity (Number of Workers, Millions) OV OX OX+Z O V+W +Y OW+Y+X+Z Question 2 1 pts Suppose that the government mandates a minimum wage, as shown in the graph...
Please chose the right answer and explain why. Thank you
Question 1 1 pts In the graph below, what area represents the producer surplus received by workers in the unregulated labor market? Wage Rate ($/hour) Labor Market Supply of Labor Minimum wage X TEL< KIN Demand for Labor 1.7 2 2.4 Quantity (Number of Workers, Millions) OV OX OX+Z O V+W +Y OW+Y+X+Z Question 2 1 pts Suppose that the government mandates a minimum wage, as shown in the graph...
Please chose the correct answer, and explain why. Thank you so much! Question 7 1 pts...
 Please chose the correct answer, and explain why. Thank you so
much!
Question 7 1 pts In the graph below, the Pigovian tax Price Market for Oil SupplyTax Etax Supply - EM Demand 20 25 millions of barrels of oil O has no impact on the quantity of oil sold. decreases the quantity of oil sold by 20 million barrels. increases the quantity of oil sold by 20 million barrels. decreases the quantity of oil sold by 5 million barrels....
Please chose the correct answer, and explain why. Thank you so
much!
Question 7 1 pts In the graph below, the Pigovian tax Price Market for Oil SupplyTax Etax Supply - EM Demand 20 25 millions of barrels of oil O has no impact on the quantity of oil sold. decreases the quantity of oil sold by 20 million barrels. increases the quantity of oil sold by 20 million barrels. decreases the quantity of oil sold by 5 million barrels....
Please answer the following questions and explain each answer. Thank you so much for your help....
 Please answer the following questions and explain each answer.
Thank you so much for your help.
Question 9 1 pts Suppose that the market equilibrium price for a basic medical check-up is $50, in a market in which there is no health insurance. To encourage more people to get a check- up, the local government mandates that the price of a check-up cannot be more than $40. Is this a price floor or a price ceiling? This example describes neither...
Please answer the following questions and explain each answer.
Thank you so much for your help.
Question 9 1 pts Suppose that the market equilibrium price for a basic medical check-up is $50, in a market in which there is no health insurance. To encourage more people to get a check- up, the local government mandates that the price of a check-up cannot be more than $40. Is this a price floor or a price ceiling? This example describes neither...
Please chose the correct answer, and explain why if possible. Thank you so much! Question 4...
 Please chose the correct answer, and explain why if possible.
Thank you so much!
Question 4 1 pts From the perspective of economic efficiency, an unregulated market outcome in the presence of a negative externality results in O a price and quantity that are both too low. the correct price and quantity. a price and quantity that are both too high. a price that is too high and a quantity that is too low. a price that is too low...
Please chose the correct answer, and explain why if possible.
Thank you so much!
Question 4 1 pts From the perspective of economic efficiency, an unregulated market outcome in the presence of a negative externality results in O a price and quantity that are both too low. the correct price and quantity. a price and quantity that are both too high. a price that is too high and a quantity that is too low. a price that is too low...
Please show all of the work. Thank you:) 11. Disequilibrium - Price floors The following graph...
 Please show all of the
work. Thank you:)
11. Disequilibrium - Price floors The following graph shows the labor market in the fast-food industry in the fictional town of Supersize City Use the graph input tool to help you answer the following questions. You will not be graded on any changes you make to this graph Note: Once you enter a value in a white field, the graph and any corresponding amounts in each grey field will change accordingly Graph...
Please show all of the
work. Thank you:)
11. Disequilibrium - Price floors The following graph shows the labor market in the fast-food industry in the fictional town of Supersize City Use the graph input tool to help you answer the following questions. You will not be graded on any changes you make to this graph Note: Once you enter a value in a white field, the graph and any corresponding amounts in each grey field will change accordingly Graph...
Question 1 1 pts Consider a competitive market of ice cream with upward sloping and downward...
 Question 1 1 pts Consider a competitive market of ice cream with upward sloping and downward sloping supply and demand, respectively. If consumers now prefer smoothie - a substitution for ice cream and at the same time, the wage rate of ice cream workers is going up, what will be the effect on the equilibrium price and quantity? Both the price and quantity will decrease. The quantity will increase but the price could either rise, fall, or remain the same....
I need help filling this out. Thank you! Homework (Ch 06) 4. Minimum wage legislation The...
 I need help filling this out. Thank you!
Homework (Ch 06) 4. Minimum wage legislation The following graph shows the labor market in the fast-food industry in the fictional town of Supersize City. Use the graph input tool to help you answer the following questions. You will not be graded on any changes you make to this graph. Note: Once you enter a value in a white field, the graph and any corresponding amounts in each grey field will change...
I need help filling this out. Thank you!
Homework (Ch 06) 4. Minimum wage legislation The following graph shows the labor market in the fast-food industry in the fictional town of Supersize City. Use the graph input tool to help you answer the following questions. You will not be graded on any changes you make to this graph. Note: Once you enter a value in a white field, the graph and any corresponding amounts in each grey field will change...
Problems & Applications (Ch 06) Suppose the minimum wage is $6 per hour in the market...
 Problems & Applications (Ch 06) Suppose the minimum wage is $6 per hour in the market for unskilled labor, as shown on the following graph Use the grey point (star symbol) to indicate the market equilibrium wage and quantity of labor in the absence of a minimum wage. Then use the purple point (diamond symbol) to indicate the level of employment at the minimum wage provided, and use the orange point (square symbol) to indicate the quantity of labor supplied...
The graph on the right shows the demand for and supply of labor in a market...
 The graph on the right shows the demand for and supply of labor in a market with an equilibrium wage rate of $9 per hour. Labor supply Show the impact on the graph if a minimum wage of $11 per hour is enacted. 1.) Using the point drawing tool, plot the point that illustrates the quantity of labor demanded when the minimum wage is set at $11 per hour. Label your point 'A.' 2.) Using the point drawing tool, plot...
Please help with these questions, Question 5 0.16 pts When firms in a market expect the...
 Please help with these questions,
Question 5 0.16 pts When firms in a market expect the price of their products to rise, the supply curve of their goods causing the equilibrium price to O decreases; rise increases; rise and the equilibrium quantity to fall decreases; fall increases; fall O increases; rise Question 6 0.16 pts Taxes cause the equilibrium price of a good to Ogo up only for producers. O decrease O go down only for consumers O increase. remain...
Please help with these questions,
Question 5 0.16 pts When firms in a market expect the price of their products to rise, the supply curve of their goods causing the equilibrium price to O decreases; rise increases; rise and the equilibrium quantity to fall decreases; fall increases; fall O increases; rise Question 6 0.16 pts Taxes cause the equilibrium price of a good to Ogo up only for producers. O decrease O go down only for consumers O increase. remain...
 Please chose the right answer and explain why. Thank you
Question 1 1 pts In the graph below, what area represents the producer surplus received by workers in the unregulated labor market? Wage Rate ($/hour) Labor Market Supply of Labor Minimum wage X TEL< KIN Demand for Labor 1.7 2 2.4 Quantity (Number of Workers, Millions) OV OX OX+Z O V+W +Y OW+Y+X+Z Question 2 1 pts Suppose that the government mandates a minimum wage, as shown in the graph...
Please chose the right answer and explain why. Thank you
Question 1 1 pts In the graph below, what area represents the producer surplus received by workers in the unregulated labor market? Wage Rate ($/hour) Labor Market Supply of Labor Minimum wage X TEL< KIN Demand for Labor 1.7 2 2.4 Quantity (Number of Workers, Millions) OV OX OX+Z O V+W +Y OW+Y+X+Z Question 2 1 pts Suppose that the government mandates a minimum wage, as shown in the graph...
 Please chose the correct answer, and explain why. Thank you so
much!
Question 7 1 pts In the graph below, the Pigovian tax Price Market for Oil SupplyTax Etax Supply - EM Demand 20 25 millions of barrels of oil O has no impact on the quantity of oil sold. decreases the quantity of oil sold by 20 million barrels. increases the quantity of oil sold by 20 million barrels. decreases the quantity of oil sold by 5 million barrels....
Please chose the correct answer, and explain why. Thank you so
much!
Question 7 1 pts In the graph below, the Pigovian tax Price Market for Oil SupplyTax Etax Supply - EM Demand 20 25 millions of barrels of oil O has no impact on the quantity of oil sold. decreases the quantity of oil sold by 20 million barrels. increases the quantity of oil sold by 20 million barrels. decreases the quantity of oil sold by 5 million barrels....
 Please answer the following questions and explain each answer.
Thank you so much for your help.
Question 9 1 pts Suppose that the market equilibrium price for a basic medical check-up is $50, in a market in which there is no health insurance. To encourage more people to get a check- up, the local government mandates that the price of a check-up cannot be more than $40. Is this a price floor or a price ceiling? This example describes neither...
Please answer the following questions and explain each answer.
Thank you so much for your help.
Question 9 1 pts Suppose that the market equilibrium price for a basic medical check-up is $50, in a market in which there is no health insurance. To encourage more people to get a check- up, the local government mandates that the price of a check-up cannot be more than $40. Is this a price floor or a price ceiling? This example describes neither...
 Please chose the correct answer, and explain why if possible.
Thank you so much!
Question 4 1 pts From the perspective of economic efficiency, an unregulated market outcome in the presence of a negative externality results in O a price and quantity that are both too low. the correct price and quantity. a price and quantity that are both too high. a price that is too high and a quantity that is too low. a price that is too low...
Please chose the correct answer, and explain why if possible.
Thank you so much!
Question 4 1 pts From the perspective of economic efficiency, an unregulated market outcome in the presence of a negative externality results in O a price and quantity that are both too low. the correct price and quantity. a price and quantity that are both too high. a price that is too high and a quantity that is too low. a price that is too low...
 Please show all of the
work. Thank you:)
11. Disequilibrium - Price floors The following graph shows the labor market in the fast-food industry in the fictional town of Supersize City Use the graph input tool to help you answer the following questions. You will not be graded on any changes you make to this graph Note: Once you enter a value in a white field, the graph and any corresponding amounts in each grey field will change accordingly Graph...
Please show all of the
work. Thank you:)
11. Disequilibrium - Price floors The following graph shows the labor market in the fast-food industry in the fictional town of Supersize City Use the graph input tool to help you answer the following questions. You will not be graded on any changes you make to this graph Note: Once you enter a value in a white field, the graph and any corresponding amounts in each grey field will change accordingly Graph...
 Question 1 1 pts Consider a competitive market of ice cream with upward sloping and downward sloping supply and demand, respectively. If consumers now prefer smoothie - a substitution for ice cream and at the same time, the wage rate of ice cream workers is going up, what will be the effect on the equilibrium price and quantity? Both the price and quantity will decrease. The quantity will increase but the price could either rise, fall, or remain the same....
 I need help filling this out. Thank you!
Homework (Ch 06) 4. Minimum wage legislation The following graph shows the labor market in the fast-food industry in the fictional town of Supersize City. Use the graph input tool to help you answer the following questions. You will not be graded on any changes you make to this graph. Note: Once you enter a value in a white field, the graph and any corresponding amounts in each grey field will change...
I need help filling this out. Thank you!
Homework (Ch 06) 4. Minimum wage legislation The following graph shows the labor market in the fast-food industry in the fictional town of Supersize City. Use the graph input tool to help you answer the following questions. You will not be graded on any changes you make to this graph. Note: Once you enter a value in a white field, the graph and any corresponding amounts in each grey field will change...
 Problems & Applications (Ch 06) Suppose the minimum wage is $6 per hour in the market for unskilled labor, as shown on the following graph Use the grey point (star symbol) to indicate the market equilibrium wage and quantity of labor in the absence of a minimum wage. Then use the purple point (diamond symbol) to indicate the level of employment at the minimum wage provided, and use the orange point (square symbol) to indicate the quantity of labor supplied...
 The graph on the right shows the demand for and supply of labor in a market with an equilibrium wage rate of $9 per hour. Labor supply Show the impact on the graph if a minimum wage of $11 per hour is enacted. 1.) Using the point drawing tool, plot the point that illustrates the quantity of labor demanded when the minimum wage is set at $11 per hour. Label your point 'A.' 2.) Using the point drawing tool, plot...
 Please help with these questions,
Question 5 0.16 pts When firms in a market expect the price of their products to rise, the supply curve of their goods causing the equilibrium price to O decreases; rise increases; rise and the equilibrium quantity to fall decreases; fall increases; fall O increases; rise Question 6 0.16 pts Taxes cause the equilibrium price of a good to Ogo up only for producers. O decrease O go down only for consumers O increase. remain...
Please help with these questions,
Question 5 0.16 pts When firms in a market expect the price of their products to rise, the supply curve of their goods causing the equilibrium price to O decreases; rise increases; rise and the equilibrium quantity to fall decreases; fall increases; fall O increases; rise Question 6 0.16 pts Taxes cause the equilibrium price of a good to Ogo up only for producers. O decrease O go down only for consumers O increase. remain...
Most questions answered within 3 hours.
-
Please help me with FLOWCHART and UML diagram for class,
thank you!
#include <iostream>
#include <fstream>...
asked 10 minutes ago -
3. Describe the “logic circuit” of the Lac operon. Which
proteins are bound or not to...
asked 11 minutes ago -
Ayesha’s adjusted gross income is $60,000 in 2019. She donated a
piece of artwork with a...
asked 18 minutes ago -
For Dijkstra’s shortest path algorithm:
a. Give the Big-O time for Dijkstra’s shortest path algorithm
and...
asked 30 minutes ago -
Phosphorus violates the 'octet rule' in biological molecules,
forming more covalent bonds than expected based on...
asked 33 minutes ago -
A 1.3 eV electron has a 10-4 probability of tunneling
through a 2.4 eV potential barrier....
asked 52 minutes ago -
What is the one ingredient that is common to being successful
with all stakeholders?
profit
trust...
asked 51 minutes ago -
Write an assembly language 32 bit program that reads in lines of
text by a .txt...
asked 53 minutes ago -
what is the density ( in g/L) of hydrogen gas at 29 degrees C and a...
asked 1 hour ago -
5-6. You are considering three investment alternatives for some
spare cash: Old Reliable Corporation stock (A1),...
asked 54 minutes ago -
Problem 16-02
Receivables Investment
Medwig Corporation has a DSO of 45 days. The company averages
$7,250...
asked 1 hour ago -
Mr. Brown hired Lowe's Maintenance Services Limited to repair
and paint the exterior wall of his...
asked 1 hour ago