

Homework Answers
Add Answer to:
Comparative Income Statements For Years Ended December 31, 2019, 2018, and 2017 2019 2018 2017 Sales...
Saved mework KORBIN COMPANY Comparative Income Statements For Years Ended December 31, 2019, 2018, and 2017...
 Saved mework KORBIN COMPANY Comparative Income Statements For Years Ended December 31, 2019, 2018, and 2017 2019 2018 2017 Sales $555,000 $340,000 $278,000 Cost of goods sold 283,500 212, 500 153,900 Gross profit 271, 500 127,500 124,100 Selling expenses 102,900 46,920 50,800 Administrative expenses 50, 668 29,920 22,800 Total expenses 153, 568 76,840 73,600 Income before taxes 117,932 5 0, 660 50,500 Income tax expense 40,800 10,370 15,670 Net income $ 77,132 $ 40,290 $ 34,830 KORBIN COMPANY Comparative Balance...
Selected comparative financial statements of Korbin Company follow KORBIN COMPANY Comparative Income Statements For Years Ended...
 Selected comparative financial statements of Korbin Company follow KORBIN COMPANY Comparative Income Statements For Years Ended December 31, 2017, 2016, and 2015 2017 2016 2015 $555,000 $340,000 $278,000 Sales Cost of goods sold Gross profit Selling expenses Administrative expenses Total expenses Income before taxes Income taxes Net income 50,800 22,800 73,600 50,500 15,670 $ 77,132 40,290 34,830 283,500 212,500 153,900 271,500 127,500 124,100 46,920 29,920 76,840 50,660 10,370 102,900 50,668 153,568 117,932 40,800 KORBIN COMPANY Comparative Balance Sheets December 31,...
KORBIN COMPANY Comparative Balance Sheets December 31, 2019, 2018, and 2017 2019 2018 2017 Assets Current...
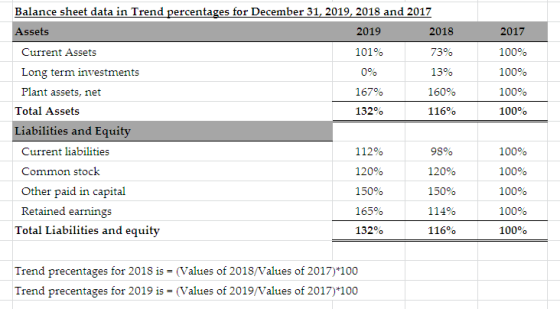
KORBIN COMPANY Comparative Balance Sheets December 31, 2019, 2018, and 2017 2019 2018 2017 Assets Current assets $ 52,390 $ 37,924 $ 51,748 Long-term investments 0 500 3,950 Plant assets, net 100,000 96,000 60,000 Total assets $ 152,390 $ 134,424 $ 115,698 Liabilities and Equity Current liabilities $ 22,800 $ 19,960 $ 20,300 Common stock 72,000 72,000 60,000 Other paid-in capital 9,000 9,000 6,000 Retained earnings 48,590 33,464 29,398 Total liabilities and equity $ 152,390 $ 134,424 $ 115,698 3....
ove & EX Check KORBIN COMPANY Comparative Income Statements For Year's Ended December 31, 2019, 2018,...
 ove & EX Check KORBIN COMPANY Comparative Income Statements For Year's Ended December 31, 2019, 2018, and 2017 2019 2018 2017 Sales $555,000 $ 340,000 $278,000 Cost of goods sold 283,500 212,500 153,900 Gross profit 271,500 127,500 124,100 Selling expenses 102,900 46,920 50,80 Administrative expenses 50,668 29,920 22,800 Total expenses 153,568 76,840 73,600 Income before taxes 117,932 50,660 50,500 Income tax expense 40,800 10,370 15,670 Net income $ 77,132 $ 40,290 $ 34,830 2018 2017 KORBIN COMPANY Comparative Balance Sheets...
Selected comparative financial statements of Korbin Company follow. KORBIN COMPANY Comparative Income Statements For Years Ended...
Selected comparative financial statements of Korbin Company follow. KORBIN COMPANY Comparative Income Statements For Years Ended December 31, 2019, 2018, and 2017 2019 2018 2017 Sales $ 555,000 $ 340,000 $ 278,000 Cost of goods sold 283,500 212,500 153,900 Gross profit 271,500 127,500 124,100 Selling expenses 102,900 46,920 50,800 Administrative expenses 50,668 29,920 22,800 Total expenses 153,568 76,840 73,600 Income before taxes 117,932 50,660 50,500 Income tax expense 40,800 10,370 15,670 Net income $ 77,132 $ 40,290 $ 34,830 KORBIN...
Required information [The following information applies to the questions displayed below.) Selected comparative financial statements of...
 Required information [The following information applies to the questions displayed below.) Selected comparative financial statements of Korbin Company follow. KORBIN COMPANY Comparative Income Statements For Years Ended December 31, 2019, 2018, and 2017 2019 2018 2017 Sales $555,000 $340,000 $278,000 Cost of goods sold 283,500 212,500 153,900 Gross profit 271,500 127,500 124,100 Selling expenses 102,900 46,920 5 0.800 Administrative expenses 50,668 29,920 22,800 Total expenses 153,568 76,840 73,600 Income before taxes 117,932 50,660 50,500 Income tax expense 40,800 10,370 15,670...
[The following information applies to the questions displayed below.] Selected comparative financial statements of Korbin Company...
[The following information applies to the questions displayed below.] Selected comparative financial statements of Korbin Company follow. KORBIN COMPANY Comparative Income Statements For Years Ended December 31, 2019, 2018, and 2017 2019 2018 2017 Sales $ 555,000 $ 340,000 $ 278,000 Cost of goods sold 283,500 212,500 153,900 Gross profit 271,500 127,500 124,100 Selling expenses 102,900 46,920 50,800 Administrative expenses 50,668 29,920 22,800 Total expenses 153,568 76,840 73,600 Income before taxes 117,932 50,660 50,500 Income tax expense 40,800 10,370 15,670...
KORBIN COMPANY Comparative Income Statements For Years Ended December 31, 2018, 2017, and 2016 2018 2017...
 KORBIN COMPANY Comparative Income Statements For Years Ended December 31, 2018, 2017, and 2016 2018 2017 2016 Sales $389,743 $298,575 $207,200 Cost of goods sold 234,625 188,401 132,608 Gross profit 155, 118 110,174 74,592 Selling expenses 55,344 41,203 27, 350 Administrative expenses 35,077 26,275 | 17,198 Total expenses 90,421 67,478 44,548 Income before taxes 64,697 42,696 30,044 Income tax expense 12,034 8,753 6,099 Net income $ 52,663 $ 33,943 $ 23,945 KORBIN COMPANY Comparative Balance Sheets December 31, 2018, 2017,...
Selected comparative financial statements of Korbin Company follow. KORBIN COMPANY Comparative Income Statements For Years Ended...
 Selected comparative financial statements of Korbin Company follow. KORBIN COMPANY Comparative Income Statements For Years Ended December 31, 2019, 2018, and. 2017 2019 2018 2017 $434,323 $332,727 $230,900 Sales Cost of goods sold 261,462 Gross profit Selling expenses Administrative 209,951 122,776 147,776 83,124 172,861 61,674 45,916 30,479 39,089 29,280 19,165 expenses Total expenses Income before 100,763 75,196 49,644 72,098 47,580 33,480 taxes Income tax expense 13,410 9,754 6,796 $58,688 $ 37,826 26,684 Net income KORBIN COMPANY Comparative Balance Sheets December...
Required information [The following information applies to the questions displayed below) Selected comparative financial statements of...
 Required information [The following information applies to the questions displayed below) Selected comparative financial statements of Korbin Company follow. KORBIN COMPANY Comparative Income Statements For Years Ended December 31, 2019, 2018, and 2017 2019 2018 2017 Sales $555,000 $340,000 $278,000 Cost of goods sold 283,500 212,500 153,900 Gross profit 271,500 127,500 124, 100 Selling expenses 102,900 46,920 50,000 Administrative expenses 50,668 29,920 22,800 Total expenses 153,568 76,840 73,600 Income before taxes 117,932 50,660 50,500 Income tax expense 40, 800 10,370...
 Saved mework KORBIN COMPANY Comparative Income Statements For Years Ended December 31, 2019, 2018, and 2017 2019 2018 2017 Sales $555,000 $340,000 $278,000 Cost of goods sold 283,500 212, 500 153,900 Gross profit 271, 500 127,500 124,100 Selling expenses 102,900 46,920 50,800 Administrative expenses 50, 668 29,920 22,800 Total expenses 153, 568 76,840 73,600 Income before taxes 117,932 5 0, 660 50,500 Income tax expense 40,800 10,370 15,670 Net income $ 77,132 $ 40,290 $ 34,830 KORBIN COMPANY Comparative Balance...
 Selected comparative financial statements of Korbin Company follow KORBIN COMPANY Comparative Income Statements For Years Ended December 31, 2017, 2016, and 2015 2017 2016 2015 $555,000 $340,000 $278,000 Sales Cost of goods sold Gross profit Selling expenses Administrative expenses Total expenses Income before taxes Income taxes Net income 50,800 22,800 73,600 50,500 15,670 $ 77,132 40,290 34,830 283,500 212,500 153,900 271,500 127,500 124,100 46,920 29,920 76,840 50,660 10,370 102,900 50,668 153,568 117,932 40,800 KORBIN COMPANY Comparative Balance Sheets December 31,...
 ove & EX Check KORBIN COMPANY Comparative Income Statements For Year's Ended December 31, 2019, 2018, and 2017 2019 2018 2017 Sales $555,000 $ 340,000 $278,000 Cost of goods sold 283,500 212,500 153,900 Gross profit 271,500 127,500 124,100 Selling expenses 102,900 46,920 50,80 Administrative expenses 50,668 29,920 22,800 Total expenses 153,568 76,840 73,600 Income before taxes 117,932 50,660 50,500 Income tax expense 40,800 10,370 15,670 Net income $ 77,132 $ 40,290 $ 34,830 2018 2017 KORBIN COMPANY Comparative Balance Sheets...
 Required information [The following information applies to the questions displayed below.) Selected comparative financial statements of Korbin Company follow. KORBIN COMPANY Comparative Income Statements For Years Ended December 31, 2019, 2018, and 2017 2019 2018 2017 Sales $555,000 $340,000 $278,000 Cost of goods sold 283,500 212,500 153,900 Gross profit 271,500 127,500 124,100 Selling expenses 102,900 46,920 5 0.800 Administrative expenses 50,668 29,920 22,800 Total expenses 153,568 76,840 73,600 Income before taxes 117,932 50,660 50,500 Income tax expense 40,800 10,370 15,670...
 KORBIN COMPANY Comparative Income Statements For Years Ended December 31, 2018, 2017, and 2016 2018 2017 2016 Sales $389,743 $298,575 $207,200 Cost of goods sold 234,625 188,401 132,608 Gross profit 155, 118 110,174 74,592 Selling expenses 55,344 41,203 27, 350 Administrative expenses 35,077 26,275 | 17,198 Total expenses 90,421 67,478 44,548 Income before taxes 64,697 42,696 30,044 Income tax expense 12,034 8,753 6,099 Net income $ 52,663 $ 33,943 $ 23,945 KORBIN COMPANY Comparative Balance Sheets December 31, 2018, 2017,...
 Selected comparative financial statements of Korbin Company follow. KORBIN COMPANY Comparative Income Statements For Years Ended December 31, 2019, 2018, and. 2017 2019 2018 2017 $434,323 $332,727 $230,900 Sales Cost of goods sold 261,462 Gross profit Selling expenses Administrative 209,951 122,776 147,776 83,124 172,861 61,674 45,916 30,479 39,089 29,280 19,165 expenses Total expenses Income before 100,763 75,196 49,644 72,098 47,580 33,480 taxes Income tax expense 13,410 9,754 6,796 $58,688 $ 37,826 26,684 Net income KORBIN COMPANY Comparative Balance Sheets December...
 Required information [The following information applies to the questions displayed below) Selected comparative financial statements of Korbin Company follow. KORBIN COMPANY Comparative Income Statements For Years Ended December 31, 2019, 2018, and 2017 2019 2018 2017 Sales $555,000 $340,000 $278,000 Cost of goods sold 283,500 212,500 153,900 Gross profit 271,500 127,500 124, 100 Selling expenses 102,900 46,920 50,000 Administrative expenses 50,668 29,920 22,800 Total expenses 153,568 76,840 73,600 Income before taxes 117,932 50,660 50,500 Income tax expense 40, 800 10,370...
Most questions answered within 3 hours.
-
A hospital performs 100 surgeries per week. The probability that
complications after surgery occur is 10%....
asked 23 seconds from now -
A 5.20 mW helium neon laser emits a visible laser beam with a
wavelength of 633...
asked 10 seconds ago -
In preparing its cash flow statement for the year ended December
31, 2018, Green Co. gathered...
asked 1 minute ago -
Donna is 18 years old and full time accounting student.She is
saving for an overseas holiday...
asked 1 minute ago -
Service-oriented architectures (SOA) provide
object-oriented architectures for web platforms that represent a
collection of services. SOA...
asked 2 minutes ago -
Le Terroir Winery is considering an expansion project to produce
fine wines. The trial expansion will...
asked 11 minutes ago -
The Bahraini public budget experiences deficit in the last
seven years, what are procedures are taken...
asked 18 minutes ago -
You invested $30,000 in a mutual fund at the beginning of the
year when the NAV...
asked 22 minutes ago -
Would you expect the price elasticity of supply for guitars to
be more inelastic in the...
asked 23 minutes ago -
A snowmobile is originally at the point with position vector
30.1 m at 95.0° counterclockwise from...
asked 23 minutes ago -
MAN3240 Organizational Behavior
In one to two paragraphs
6.) How can understanding emotions make me more...
asked 31 minutes ago -
Identify one individual who, in your opinion, is an excellent
leader. List the qualities that this...
asked 29 minutes ago