
Homework Answers
Add Answer to:
Common-size and trend percents for Rustynail Company's sales, cost of goods sold, and expenses follow. Sales...
Common-size and trend percents for Rustynail Company's sales, cost of goods sold, and expenses follow Sales...
 Common-size and trend percents for Rustynail Company's sales, cost of goods sold, and expenses follow Sales Common-site Percent 2017 2016 2015 100.00 100.00 100.01 63.4 61.2 56.4 14.3 13.8 14.1 Trend Percents 2017 2016 2015 104.56 103.36 100.00 117.5 112.1 100.0 106.1 101.1 100.0 Cost of goods sold Operating expenses Determine the net income for the following years. (Enter all amounts as positive values.) 2017 2016 2015 $ Sales Cost of Goods Sold Operating Expenses Net Income 100,000 56,400 14,100...
Common-size and trend percents for Rustynail Company's sales, cost of goods sold, and expenses follow. Common-Size...
Common-size and trend percents for Rustynail Company's sales, cost of goods sold, and expenses follow. Common-Size Percents Trend Percents 2017 2016 2015 2017 2016 2015 Sales 100.0 % 100.0 % 100.0 % 104.3 % 103.1 % 100.0 % Cost of goods sold 63.5 61.3 58.0 114.2 109.0 100.0 Operating expenses 14.3 13.8 14.1 105.8 100.9 100.0 Determine the net income for the following years. 2017 2016 2015 Sales $100,000 Cost of Goods Sold 58,000 Operating Expenses 14,100 Net Income $27,900...
Common-size and trend percents for Rustynail Company's sales, cost of goods sold, and expenses follow. Common-Size...
 Common-size and trend percents for Rustynail Company's sales, cost of goods sold, and expenses follow. Common-Size Percents Trend Percents 2 Yrs Ago 2 Yrs Ago 1 Yr Ago Current Yr 1 Yr Ago 100.0% Current Yr Sales 100.0% 100.0% 104.4% 100.0% 103.2% Cost of goods sold Total expenses 57.6 63.5 61.3 115.1 109.8 100.0 14.3 14.1 100.0 13.8 105.9 101.0 Determine the net income for the following years. Did the net income increase, decrease, or remain unchanged in this three-year...
Common-sire and trend percents for Rustynail Company's sales, cost of goods sold, and expenses follow. Common-Size...
 Common-sire and trend percents for Rustynail Company's sales, cost of goods sold, and expenses follow. Common-Size Percents Trend Percents 2015 2014 2013 2015 2014 2013 Sales 100.0% 100.0% 100.0% 104,4% 103.2% 100.0% Cost of goods sold 63. 1 60.9 57.3 115.0 109.7 100.0 Total expenses 14.3 13.8 14.1 105.9 101.0 100.0 Determine the net income for the following years. (Enter all amounts as positive values. Round your answers to nearest whole dollar.) 2015 2014 $ Sales Cost of Goods Sold...
Common-size and trend percents for Rustynail Company's sales, cost of goods sold, and expenses follow. Sales...
 Common-size and trend percents for Rustynail Company's sales, cost of goods sold, and expenses follow. Sales Cost of goods sold Total expenses Common-Size Percents Current Yr 1 Yr Ago 2 Yrs Ago 100.0% 100.0% 63.6 61.4 57.9 14.4 13.9 14.2 Current Yr 105.1% 115.4 106.7 Trend Percents 1 Yr Ago 103.9% 110.2 101.7 2 Yrs Ago 100.0% 100.0 100.0 Determine the net income for the following years. Did the net income increase, decrease, or remain unchanged in this three-year period?...
Check my work Common-size and trend percents for Rustynail Company's sales, cost of goods sold, and...
 Check my work Common-size and trend percents for Rustynail Company's sales, cost of goods sold, and expenses follow. Sales Cost of goods sold Total expenses Common-Size Percents Current Yr 1 Yr Ago 2 Yrs Ago 100.00 100.00 100.00 63.4 61.2 57.4 13.8 14.1 Current Y 104.58 115.4 106.1 Trend Percenta 1 Yr Ago 103.38 110.1 101.1 2 Yrs Ago 100.00 100.0 100.0 14.3 Book Determine the net income for the following years. Did the net income increase, decrease, or remain...
Question 3 Vertical analysis (common-size) percentages for Austin Company's sales, cost of goods sold, and expenses...
 Question 3 Vertical analysis (common-size) percentages for Austin Company's sales, cost of goods sold, and expenses are listed here Vertical Analysis 2018 2017 2016 Sales revenue 100.0 % 100.0 % 100.0 % Cost of goods sold 61.2 62.4 63.5 Expenses 26.5 27.4 28.5 Calculate net income as a percentage of sales. (Round answers to 1 decimal place, e.g. 15.2.) 2018 2017 2016 Net income % % olo Did Austin Company's net income as a percent of sales increase, decrease, or...
Check my work Exercise 13-5 Determining income effects from common-size and trend percents LO P1, P2...
 Check my work Exercise 13-5 Determining income effects from common-size and trend percents LO P1, P2 Common-size and trend percents for Rustynail Company's sales, cost of goods sold, and expenses follow. 1.11 points Sales Cost of goods sold Total expenses Common-Size Percents Current Yr 1 Yr Ago 2 Yrs Ago 100.0% 100.0% 100.0% 63.6 61.4 57.9 14.4 13.9 14.2 Trend Percents Current Yr 1 Yr Ago 2 Yrs Ago 105.1% 103.9% 100.0% 115.4 110.2 100.0 106.7 101.7 100.0 eBook Hint...
Check my work Exercise 13-5 Determining income effects from common-size and trend percents LO P1, P2...
 Check my work Exercise 13-5 Determining income effects from common-size and trend percents LO P1, P2 Common-size and trend percents for Rustynail Company's sales, cost of goods sold, and expenses follow. 1.11 points Sales Cost of goods sold Total expenses Common-Size Percents Current Yr1 Yr Ago 2 Yrs Ago 100.0% 100.0% 100.0% 63. 6 61.4. 57.9 14.4 9 13. 1 4.2 Trend Percents Current Yr 1 Yr Ago 2 Yrs Ago 105.1% 103.9% 100.0% 115.4 110.2 100.0 106.7 101.7 100.0...
Exercise 13-3 Computing and interpreting common-size percents LO P1 Sales Cost of goods sold Accounts receivable...
 Exercise 13-3 Computing and interpreting common-size percents LO P1 Sales Cost of goods sold Accounts receivable 2019 2018 2017 2016 2015 $ 716,496 $ 477,664 $ 373, 175 $ 261,877 $ 196,900 353,683 235,605 186,256 129, 920 96,481 34,678 27,896 25,488 15,294 13,468 Compute trend percents for the above accounts, using 2015 as the base year. Trend Percent for Net Sales: Choose Numerator: 6 B O 2 ET . Trend percent . 2019: 2018: 2017: 2016: Trend Percent for Cost...
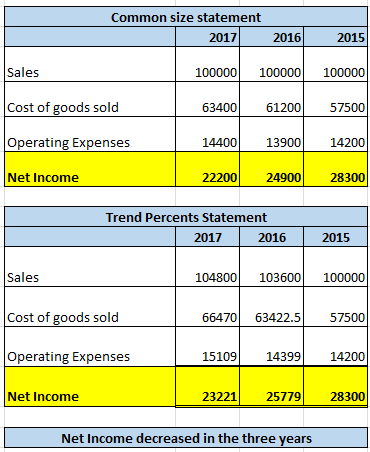
 Common-size and trend percents for Rustynail Company's sales, cost of goods sold, and expenses follow Sales Common-site Percent 2017 2016 2015 100.00 100.00 100.01 63.4 61.2 56.4 14.3 13.8 14.1 Trend Percents 2017 2016 2015 104.56 103.36 100.00 117.5 112.1 100.0 106.1 101.1 100.0 Cost of goods sold Operating expenses Determine the net income for the following years. (Enter all amounts as positive values.) 2017 2016 2015 $ Sales Cost of Goods Sold Operating Expenses Net Income 100,000 56,400 14,100...
 Common-size and trend percents for Rustynail Company's sales, cost of goods sold, and expenses follow. Common-Size Percents Trend Percents 2 Yrs Ago 2 Yrs Ago 1 Yr Ago Current Yr 1 Yr Ago 100.0% Current Yr Sales 100.0% 100.0% 104.4% 100.0% 103.2% Cost of goods sold Total expenses 57.6 63.5 61.3 115.1 109.8 100.0 14.3 14.1 100.0 13.8 105.9 101.0 Determine the net income for the following years. Did the net income increase, decrease, or remain unchanged in this three-year...
 Common-sire and trend percents for Rustynail Company's sales, cost of goods sold, and expenses follow. Common-Size Percents Trend Percents 2015 2014 2013 2015 2014 2013 Sales 100.0% 100.0% 100.0% 104,4% 103.2% 100.0% Cost of goods sold 63. 1 60.9 57.3 115.0 109.7 100.0 Total expenses 14.3 13.8 14.1 105.9 101.0 100.0 Determine the net income for the following years. (Enter all amounts as positive values. Round your answers to nearest whole dollar.) 2015 2014 $ Sales Cost of Goods Sold...
 Common-size and trend percents for Rustynail Company's sales, cost of goods sold, and expenses follow. Sales Cost of goods sold Total expenses Common-Size Percents Current Yr 1 Yr Ago 2 Yrs Ago 100.0% 100.0% 63.6 61.4 57.9 14.4 13.9 14.2 Current Yr 105.1% 115.4 106.7 Trend Percents 1 Yr Ago 103.9% 110.2 101.7 2 Yrs Ago 100.0% 100.0 100.0 Determine the net income for the following years. Did the net income increase, decrease, or remain unchanged in this three-year period?...
 Check my work Common-size and trend percents for Rustynail Company's sales, cost of goods sold, and expenses follow. Sales Cost of goods sold Total expenses Common-Size Percents Current Yr 1 Yr Ago 2 Yrs Ago 100.00 100.00 100.00 63.4 61.2 57.4 13.8 14.1 Current Y 104.58 115.4 106.1 Trend Percenta 1 Yr Ago 103.38 110.1 101.1 2 Yrs Ago 100.00 100.0 100.0 14.3 Book Determine the net income for the following years. Did the net income increase, decrease, or remain...
 Question 3 Vertical analysis (common-size) percentages for Austin Company's sales, cost of goods sold, and expenses are listed here Vertical Analysis 2018 2017 2016 Sales revenue 100.0 % 100.0 % 100.0 % Cost of goods sold 61.2 62.4 63.5 Expenses 26.5 27.4 28.5 Calculate net income as a percentage of sales. (Round answers to 1 decimal place, e.g. 15.2.) 2018 2017 2016 Net income % % olo Did Austin Company's net income as a percent of sales increase, decrease, or...
 Check my work Exercise 13-5 Determining income effects from common-size and trend percents LO P1, P2 Common-size and trend percents for Rustynail Company's sales, cost of goods sold, and expenses follow. 1.11 points Sales Cost of goods sold Total expenses Common-Size Percents Current Yr 1 Yr Ago 2 Yrs Ago 100.0% 100.0% 100.0% 63.6 61.4 57.9 14.4 13.9 14.2 Trend Percents Current Yr 1 Yr Ago 2 Yrs Ago 105.1% 103.9% 100.0% 115.4 110.2 100.0 106.7 101.7 100.0 eBook Hint...
 Check my work Exercise 13-5 Determining income effects from common-size and trend percents LO P1, P2 Common-size and trend percents for Rustynail Company's sales, cost of goods sold, and expenses follow. 1.11 points Sales Cost of goods sold Total expenses Common-Size Percents Current Yr1 Yr Ago 2 Yrs Ago 100.0% 100.0% 100.0% 63. 6 61.4. 57.9 14.4 9 13. 1 4.2 Trend Percents Current Yr 1 Yr Ago 2 Yrs Ago 105.1% 103.9% 100.0% 115.4 110.2 100.0 106.7 101.7 100.0...
 Exercise 13-3 Computing and interpreting common-size percents LO P1 Sales Cost of goods sold Accounts receivable 2019 2018 2017 2016 2015 $ 716,496 $ 477,664 $ 373, 175 $ 261,877 $ 196,900 353,683 235,605 186,256 129, 920 96,481 34,678 27,896 25,488 15,294 13,468 Compute trend percents for the above accounts, using 2015 as the base year. Trend Percent for Net Sales: Choose Numerator: 6 B O 2 ET . Trend percent . 2019: 2018: 2017: 2016: Trend Percent for Cost...
Most questions answered within 3 hours.
-
4. Describe the role played by glutamine in the transport of
nitrogen.
asked 4 minutes ago -
Choose one:
Periodic Inventory Accounting is less expensive to maintain
than Perpetual Inventory Accounting
Periodic Inventory...
asked 6 minutes ago -
1. In IntelliJ create a new project called F1_2
2. In the Project window create a...
asked 9 minutes ago -
What is the energy released in this β+ nuclear reaction
23/12Mg→23/11Na+0/1e (The atomic mass of 23Mg...
asked 8 minutes ago -
30 mL of 1 M HCl were added to 200 mL of 0.1 M lysine solution...
asked 17 minutes ago -
The market portfolio has an expected return of 9.2% with a
volatility of 16.7% while the...
asked 22 minutes ago -
Personal selling is of special importance in B2B marketing. What
has been the impact of the...
asked 29 minutes ago -
1.With time, an appreciation in the value of the nation's
currency in the foreign exchange market...
asked 24 minutes ago -
In 2003, an organization surveyed 1 comma 510 adult Americans
and asked about a certain war,...
asked 36 minutes ago -
Blue colorin fireworks is often achieved by heating copper(I)
chloride (CuCl) to about 1200°C. Then the...
asked 30 minutes ago -
Coperto Insurers of Davenport, Iowa offers four different
insurance plans, all of which are equally popular...
asked 38 minutes ago -
A 50 mL graduated cylinder contains 25.0 mL of water. A 42.5040
g piece of gold...
asked 39 minutes ago