
Homework Answers
Add Answer to:
Consider the market for ethanol in the United States depicted in the figure to the right....
Suppose that the demand and supply curves for ethanol in the United States are represented by...
Suppose that the demand and supply curves for ethanol in the United States are represented by the following equations: QD = 1,600 − 320P QS = −800 + 640P where QD is the quantity demanded (in millions of gallons per month), QS is the quantity supplied, and P is the price (in dollars per gallon). In the scenario above, if the market is in equilibrium, the price of ethanol is $(blank) per gallon and the quantity of ethanol sold is...
The U.S. wheat market is shown in the figure below. Suppose the United States wants to...
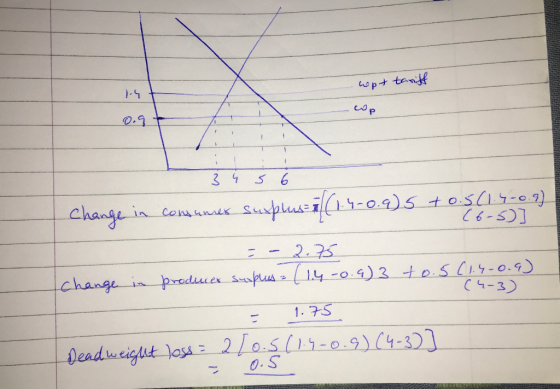
 The U.S. wheat market is shown in the figure below. Suppose the United States wants to protect its wheat industry by imposing a tariff of $1 per bushel on foreign wheat, which currently sells at the world price of $4 per bushel. Your Graph Score: 0% Price (S) CS 10 PS DWL2 DWL CS World price 20 40 60 80 100 120 140 160 180 Quantity of wheat (millions) a. Use the tool provided (CS) to draw the consumer surplus...
3. Refer to the figure. The United States is currently open to international trade in the...
 3. Refer to the figure. The United States is currently open to international trade in the market of basketballs, but domestic producers are lobbying to ban the importation of basketballs from abroad for national security reasons. Domestic producers claim that they are unable to compete with foreign producers based on price and that eventually they would be forced to close their shops domestically. This would give foreign producers the power to cut off the supply of basketballs to the United...
1) The United States sugar industry has enjoyed trade protection for several years. As a result,...
 1) The United States sugar industry has enjoyed trade protection for several years. As a result, sugar prices in the U.S. are higher than the average world price. Suppose that the domestic demand and domestic supply for sugar are as provided in the table below (assume continuous, linear domestic demand and supply curves which include the following data points for sugar): | Price ($ per Quantity Demanded Domestically Quantity Supplied Domestically pound) (Millions of Pounds per Year) (Millions of Pounds...
INTERNATIONAL TRADE WORKSHEET 2 Below, you are provided with the demand and supply curves for orange...
 INTERNATIONAL TRADE WORKSHEET 2 Below, you are provided with the demand and supply curves for orange juice. You will use this information to identify whether the country imports or exports orange juice. You will also determine whether producers and/or consumers win by engaging in international trade. $7 Price (per gallon) $6 Supply $5 $4 $3 $2 $1 Demand 30 60 210 90 120 150 180 Quantity of Orange Juice (in gallons) Part 1: Suppose that the country depicted above does...
Consider the market for wheat, depicted in the figure to the right Suppose a price floor...
 Consider the market for wheat, depicted in the figure to the right Suppose a price floor of government is imposed by the As a result of the price floor there is a of wheat Compared with the market clearing equilibrium, is the price floor efficient? What are represents the loss in efficiency in terms of consumer and producer surplus resulting from the price floor? Use the triangle drawing tool to shade in deadweight loss Label this shaded area Deadweight Loss...
Tariff Analytical Question: Figure: A Tariff on Oranges in South Africa Price of oranges Domestic supply Pt 5.00 G Pw3....
 Tariff Analytical Question: Figure: A Tariff on Oranges in South Africa Price of oranges Domestic supply Pt 5.00 G Pw3.00 Domestic demand P-1.00 100 150 250 290 Quantity of oranges Use the following graph and information to answer the following questions: 1) Assume that the world price of Oranges (Pw) is $3.00 per pound. Domestic Quantity Supply is 100, and the Domestic Quantity Demanded is 290 at the current world price of $3.00 What is the level of imports in...
please only do problem d e and f thanks! 1) The United States sugar industry has enjoyed trade protection for several y...
 please only do problem d e and f
thanks!
1) The United States sugar industry has enjoyed trade protection for several years. As a result, sugar prices in the U.S. are higher than the average world price. Suppose that the domestic demand and domestic supply for sugar are as provided in the table below (assume continuous, linear domestic demand and supply curves which include the following data points for sugar): | Price ($ per Quantity Demanded Domestically Quantity Supplied Domestically...
please only do problem d e and f
thanks!
1) The United States sugar industry has enjoyed trade protection for several years. As a result, sugar prices in the U.S. are higher than the average world price. Suppose that the domestic demand and domestic supply for sugar are as provided in the table below (assume continuous, linear domestic demand and supply curves which include the following data points for sugar): | Price ($ per Quantity Demanded Domestically Quantity Supplied Domestically...
Need help on Questions 9 and 10. Is the tariff imposed on the equilibrium price at...
 Need help on Questions 9 and 10. Is the tariff imposed on the
equilibrium price at $6 or is it imposed on the World Trade price
at $2?
Consumer Surplus, Producer Surplus and Net Benefits (Show all your work). Name (Print): Course: Use the following graph for questions 1-15. P $12- Supply SIO $8 S6 54 SZVU Demand $0 10 211 30 40 50 P.S Quantity 1. Estimate an equation for the demand and supply curves shown in the diagram...
Need help on Questions 9 and 10. Is the tariff imposed on the
equilibrium price at $6 or is it imposed on the World Trade price
at $2?
Consumer Surplus, Producer Surplus and Net Benefits (Show all your work). Name (Print): Course: Use the following graph for questions 1-15. P $12- Supply SIO $8 S6 54 SZVU Demand $0 10 211 30 40 50 P.S Quantity 1. Estimate an equation for the demand and supply curves shown in the diagram...
1) The United States sugar industry has enjoyed trade protection for several years. As a result,...
 1) The United States sugar industry has enjoyed trade protection for several years. As a result, sugar prices in the U.S. are higher than the average world price. Suppose that the domestic demand and domestic supply for sugar are as provided in the table below (assume continuous, linear domestic demand and supply curves which include the following data points for sugar): | Price ($ per Quantity Demanded Domestically Quantity Supplied Domestically pound) (Millions of Pounds per Year) (Millions of Pounds...
 The U.S. wheat market is shown in the figure below. Suppose the United States wants to protect its wheat industry by imposing a tariff of $1 per bushel on foreign wheat, which currently sells at the world price of $4 per bushel. Your Graph Score: 0% Price (S) CS 10 PS DWL2 DWL CS World price 20 40 60 80 100 120 140 160 180 Quantity of wheat (millions) a. Use the tool provided (CS) to draw the consumer surplus...
 3. Refer to the figure. The United States is currently open to international trade in the market of basketballs, but domestic producers are lobbying to ban the importation of basketballs from abroad for national security reasons. Domestic producers claim that they are unable to compete with foreign producers based on price and that eventually they would be forced to close their shops domestically. This would give foreign producers the power to cut off the supply of basketballs to the United...
 1) The United States sugar industry has enjoyed trade protection for several years. As a result, sugar prices in the U.S. are higher than the average world price. Suppose that the domestic demand and domestic supply for sugar are as provided in the table below (assume continuous, linear domestic demand and supply curves which include the following data points for sugar): | Price ($ per Quantity Demanded Domestically Quantity Supplied Domestically pound) (Millions of Pounds per Year) (Millions of Pounds...
 INTERNATIONAL TRADE WORKSHEET 2 Below, you are provided with the demand and supply curves for orange juice. You will use this information to identify whether the country imports or exports orange juice. You will also determine whether producers and/or consumers win by engaging in international trade. $7 Price (per gallon) $6 Supply $5 $4 $3 $2 $1 Demand 30 60 210 90 120 150 180 Quantity of Orange Juice (in gallons) Part 1: Suppose that the country depicted above does...
 Consider the market for wheat, depicted in the figure to the right Suppose a price floor of government is imposed by the As a result of the price floor there is a of wheat Compared with the market clearing equilibrium, is the price floor efficient? What are represents the loss in efficiency in terms of consumer and producer surplus resulting from the price floor? Use the triangle drawing tool to shade in deadweight loss Label this shaded area Deadweight Loss...
 Tariff Analytical Question: Figure: A Tariff on Oranges in South Africa Price of oranges Domestic supply Pt 5.00 G Pw3.00 Domestic demand P-1.00 100 150 250 290 Quantity of oranges Use the following graph and information to answer the following questions: 1) Assume that the world price of Oranges (Pw) is $3.00 per pound. Domestic Quantity Supply is 100, and the Domestic Quantity Demanded is 290 at the current world price of $3.00 What is the level of imports in...
 please only do problem d e and f
thanks!
1) The United States sugar industry has enjoyed trade protection for several years. As a result, sugar prices in the U.S. are higher than the average world price. Suppose that the domestic demand and domestic supply for sugar are as provided in the table below (assume continuous, linear domestic demand and supply curves which include the following data points for sugar): | Price ($ per Quantity Demanded Domestically Quantity Supplied Domestically...
please only do problem d e and f
thanks!
1) The United States sugar industry has enjoyed trade protection for several years. As a result, sugar prices in the U.S. are higher than the average world price. Suppose that the domestic demand and domestic supply for sugar are as provided in the table below (assume continuous, linear domestic demand and supply curves which include the following data points for sugar): | Price ($ per Quantity Demanded Domestically Quantity Supplied Domestically...
 Need help on Questions 9 and 10. Is the tariff imposed on the
equilibrium price at $6 or is it imposed on the World Trade price
at $2?
Consumer Surplus, Producer Surplus and Net Benefits (Show all your work). Name (Print): Course: Use the following graph for questions 1-15. P $12- Supply SIO $8 S6 54 SZVU Demand $0 10 211 30 40 50 P.S Quantity 1. Estimate an equation for the demand and supply curves shown in the diagram...
Need help on Questions 9 and 10. Is the tariff imposed on the
equilibrium price at $6 or is it imposed on the World Trade price
at $2?
Consumer Surplus, Producer Surplus and Net Benefits (Show all your work). Name (Print): Course: Use the following graph for questions 1-15. P $12- Supply SIO $8 S6 54 SZVU Demand $0 10 211 30 40 50 P.S Quantity 1. Estimate an equation for the demand and supply curves shown in the diagram...
 1) The United States sugar industry has enjoyed trade protection for several years. As a result, sugar prices in the U.S. are higher than the average world price. Suppose that the domestic demand and domestic supply for sugar are as provided in the table below (assume continuous, linear domestic demand and supply curves which include the following data points for sugar): | Price ($ per Quantity Demanded Domestically Quantity Supplied Domestically pound) (Millions of Pounds per Year) (Millions of Pounds...
Most questions answered within 3 hours.
-
1a) According to the ideal gas law, _______________.
a. a gas has infinite volume at absolute...
asked 1 hour ago -
Oakdale Fashions, Inc. had $245,000 in 2018 taxable income.
Using the tax schedule in Table 2.3...
asked 1 hour ago -
The marketing class at CSUS had an average score of 150. An
educational analyst determined that...
asked 2 hours ago -
Justin Case has purchased a $250 000 home by putting 20 % down
and taking out...
asked 2 hours ago -
1. In a labor market, marginal cost for a firm is
____________.
a. recruiting cost
b....
asked 3 hours ago -
On January 1, 2019, ABC Company issued $60,000,000 of 20-year,
10.5% bonds when the market rate...
asked 3 hours ago -
39.4% of US homes continue to use a landline in addition to cell
phone service. 3...
asked 4 hours ago -
Starting with benzene, synthesize 1-phenyl-1-butyne.
Show intermediates and reagents.
asked 5 hours ago -
Create a 32-run crossed array design with six control factors
and two noise factors such that...
asked 6 hours ago -
A 500g sample of sand from source A has the following amounts
retained on each sieve....
asked 6 hours ago -
In
your own words, please explain the essay by John Keynes wrote "The
End of Laissez...
asked 6 hours ago -
How are the matrix and pixels related? Why are smaller
pixels better for diagnostic quality?
asked 6 hours ago