Suppose that the British economy produces two goods: laptops and
books. The quantity produced and the prices of these items for 2015
and 2016 are shown in the table below: Year Quantities produced
Price ($) 2015 Laptops =50 Books =1,000 Laptops =200 Books = ? 2016
Laptops =100 Books =? Laptops =150 Books =10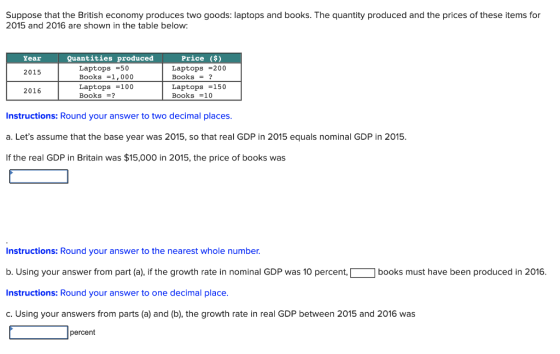
Homework Answers
Given nominal GDP of Britain in 2015 = $ 15,000
Note nominal GDP is equal to real GDP.


Book price in year 2015 = $ 5
B. In 2016 Nominal GDP increased by 10%.
NGDP of 2016 = $ 16,500


C. Real gdp of 2015 = Nominal GDP of 2015 = $ 15,000
Real GDP of 2016 = 100 × 200 + 150 × 5 = $ 20,750
Growth rate = (20,750/15,000) - 1 = 0.3833
Growth rate = 38.33%
Add Answer to:
Suppose that the British economy produces two goods: laptops and
books. The quantity produced and the...
Suppose that the British economy produces two goods: laptops and books. The quantity produced and the...
 Suppose that the British economy produces two goods: laptops and books. The quantity produced and the prices of these items for 2015 and 2016 are shown in the table below: Year 2015 Quantities produced Laptops = 60 Books – see Laptops = 70 Books = ? Price ($) Laptops = 200 Books ? Laptops - 120 Books = 8 2016 Instructions: Round your answer to two decimal places a. Let's assume that the base year was 2015, so that real...
Q1) Q2) Q3) Imagine that Canada produces only three goods: apples, bananas, and carrots. The quantities...
 Q1)
Q2)
Q3)
Imagine that Canada produces only three goods: apples, bananas, and carrots. The quantities produced and the prices of the three goods are listed below: Quantities produced 5 Goods Apples Bananas Carrots Prices ($) 2.00 1.00 10 20 1.50 Instructions: Round your answers to the nearest dollar. a. Canadian GDP is $ b. Suppose a drought hits the province of British Columbia. This drought causes the quantity of apples produced to fall to 2. Assuming that all prices...
Q1)
Q2)
Q3)
Imagine that Canada produces only three goods: apples, bananas, and carrots. The quantities produced and the prices of the three goods are listed below: Quantities produced 5 Goods Apples Bananas Carrots Prices ($) 2.00 1.00 10 20 1.50 Instructions: Round your answers to the nearest dollar. a. Canadian GDP is $ b. Suppose a drought hits the province of British Columbia. This drought causes the quantity of apples produced to fall to 2. Assuming that all prices...
2. Consider a hypothetical economy which produces three goods: TVs, books, and hamburgers. The following table...
 2. Consider a hypothetical economy which produces three goods: TVs, books, and hamburgers. The following table shows the prices and output of the three goods for the years 2015, 2016, and 2017. Hamburgers Quantity TVs Quantity Books Price ($) Hamburgers Price (S) TVs Year Price (S) 2015 Books Quantity 250 10 10 2 40 2016 300 20 12 6 3 60 2017 280 25 6 14 4 80 a. What is the percent change in production of each of the...
4. Real Versus Nominal GDP Aa Aa Consider a simple economy that produces two goods: cupcakes...
 4. Real Versus Nominal GDP Aa Aa Consider a simple economy that produces two goods: cupcakes and muffins. The following table shows the prices and quantities for the goods over a three-year period. Prices and Quantities Price of Quantity of Price of cupcakes (6) cupcakes muffins (C) 150 2 2003 200 Quantity of muffins Year 2016 2017 2018 100 150 100 Use the information from the previous table to fill in the following table. Real GDP (Base year 2016) (C)...
Suppose that a very simple economy produces three goods: pizzas, haircuts and backpacks. Suppose the quantities...
Suppose that a very simple economy produces three goods: pizzas, haircuts and backpacks. Suppose the quantities produced and their corresponding prices for 2015 and 2019 are as shown in the table. Use the information in the table to compute nominal GDP in the year 2019. Calculate real GDP in 2019 assuming the base year is 2015. Compare and explain the two results. – Word count 300 2015 2019 Product Quantity Price Quantity Price Pizzas 200 10 150 12 Haircuts 80 ...
Consider a simple economy that produces two goods: pens and erasers. The following table shows the...
Consider a simple economy that produces two goods: pens and erasers. The following table shows the prices and quantities of the goods over a three-year period. Year Pens Erasers Price Quantity Price Quantity (Dollars per pen) (Number of pens) (Dollars per eraser) (Number of erasers) 2016 1 110 2 150 2017 2 155 4 215 2018 3 120 4 180 Use the information from the preceding table to fill in the following table. Year Nominal GDP Real GDP GDP Deflator...
An economy produces only robots, pens, and pizza
 An economy produces only robots, pens, and pizza The table gives the quantities produced and prices in 2016 and 2017 The base your is 2016 What is nominal GDP in 2016 and in 2017? Nominal GDP in 2016 is $_______ Nominal GDP in 2017 is $_______ A south sea island produces only coconuts In 2010, the price of a coconut is $2.00 and the quantity produced is 350 In 2017, the price of a coconut is $1.50 and the quantity produced is 300 2010 is the base year Real GDP...
5. Real versus nominal GDP Consider a simple economy that produces two goods: pens and envelopes....
 5. Real versus nominal GDP Consider a simple economy that produces two goods: pens and envelopes. The following table shows the prices and quantities of the goods over a three-year period Pens Price Quantity (Dollars per pen) (Number of pens) 1 110 Envelopes Price Quantity (Dollars per envelope) (Number of envelopes) 180 Year 2015 4 2015 140 210 2 2017 4 100 190 4 Use the information from the preceding table to fill in the following table. Nominal GDP (Dollars)...
Consider a simple economy that produces two goods: apples and envelopes. The following table shows the prices and quantities of the goods over a three-year period.
 Consider a simple economy that produces two goods: apples and envelopes. The following table shows the prices and quantities of the goods over a three-year period. Use the information from the previous table to fill in the following table. From 2015 to 2016, nominal GDP _______, and real GDP _______.The inflation rate in 2016 was _______.Why is real GDP a more accurate measure of an economy's production than nominal GDP? Nominal GDP is adjusted for the effects of inflation or deflation, whereas real GDP...
Consider an economy that only produces two goods: strawberries and cream. Use the table below to...
 Consider an economy that only produces two goods: strawberries and cream. Use the table below to compute nominal GDP, real GDP, and the GDP deflator for each year. (Year 2014 is the base year.) Year Price of strawberries Quantity of strawberries 2014 100 Price of Quantity cream of cream $3.00 | 200 $3.50 400 $4.00 500 | 2015 | $2.00 | 2016 $3.00 125 150 Year Nominal GDP Real GDP GDP deflator 2014 100 $ 700 $ 700 2015 118...
 Suppose that the British economy produces two goods: laptops and books. The quantity produced and the prices of these items for 2015 and 2016 are shown in the table below: Year 2015 Quantities produced Laptops = 60 Books – see Laptops = 70 Books = ? Price ($) Laptops = 200 Books ? Laptops - 120 Books = 8 2016 Instructions: Round your answer to two decimal places a. Let's assume that the base year was 2015, so that real...
 Q1)
Q2)
Q3)
Imagine that Canada produces only three goods: apples, bananas, and carrots. The quantities produced and the prices of the three goods are listed below: Quantities produced 5 Goods Apples Bananas Carrots Prices ($) 2.00 1.00 10 20 1.50 Instructions: Round your answers to the nearest dollar. a. Canadian GDP is $ b. Suppose a drought hits the province of British Columbia. This drought causes the quantity of apples produced to fall to 2. Assuming that all prices...
Q1)
Q2)
Q3)
Imagine that Canada produces only three goods: apples, bananas, and carrots. The quantities produced and the prices of the three goods are listed below: Quantities produced 5 Goods Apples Bananas Carrots Prices ($) 2.00 1.00 10 20 1.50 Instructions: Round your answers to the nearest dollar. a. Canadian GDP is $ b. Suppose a drought hits the province of British Columbia. This drought causes the quantity of apples produced to fall to 2. Assuming that all prices...
 2. Consider a hypothetical economy which produces three goods: TVs, books, and hamburgers. The following table shows the prices and output of the three goods for the years 2015, 2016, and 2017. Hamburgers Quantity TVs Quantity Books Price ($) Hamburgers Price (S) TVs Year Price (S) 2015 Books Quantity 250 10 10 2 40 2016 300 20 12 6 3 60 2017 280 25 6 14 4 80 a. What is the percent change in production of each of the...
 4. Real Versus Nominal GDP Aa Aa Consider a simple economy that produces two goods: cupcakes and muffins. The following table shows the prices and quantities for the goods over a three-year period. Prices and Quantities Price of Quantity of Price of cupcakes (6) cupcakes muffins (C) 150 2 2003 200 Quantity of muffins Year 2016 2017 2018 100 150 100 Use the information from the previous table to fill in the following table. Real GDP (Base year 2016) (C)...
 5. Real versus nominal GDP Consider a simple economy that produces two goods: pens and envelopes. The following table shows the prices and quantities of the goods over a three-year period Pens Price Quantity (Dollars per pen) (Number of pens) 1 110 Envelopes Price Quantity (Dollars per envelope) (Number of envelopes) 180 Year 2015 4 2015 140 210 2 2017 4 100 190 4 Use the information from the preceding table to fill in the following table. Nominal GDP (Dollars)...
 Consider an economy that only produces two goods: strawberries and cream. Use the table below to compute nominal GDP, real GDP, and the GDP deflator for each year. (Year 2014 is the base year.) Year Price of strawberries Quantity of strawberries 2014 100 Price of Quantity cream of cream $3.00 | 200 $3.50 400 $4.00 500 | 2015 | $2.00 | 2016 $3.00 125 150 Year Nominal GDP Real GDP GDP deflator 2014 100 $ 700 $ 700 2015 118...
Most questions answered within 3 hours.
-
I already posted this question but I want a lengthy 1-page
answer.
Identify one or a...
asked 3 minutes ago -
how
many liters of carbon dioxide are produced at 100 kPa and 22
degrees celsius if...
asked 3 minutes ago -
If a business has fixed costs amounting to 80,000 and variable
costs of $70,000, in the...
asked 10 minutes ago -
A) A one-way ANOVA test:
is a left-tailed test
is a right-tailed test
is a two-tailed...
asked 2 hours ago -
A mixture of nitrogen and carbon
dioxide gases, in a 9.86 L flask at
40 °C,...
asked 3 hours ago -
11) What would be the pH of 100.0 mL of a solution that is 0.040
M...
asked 3 hours ago -
A largely aquatic division of Kingdom Fungi, rarely harmful to
humans, often found as mold/mildew, &...
asked 3 hours ago -
just another way of saying good target marketing and
understanding customer needs? Why or why not?
asked 4 hours ago -
Consider the quantum number sets listed below.
What is the name of the smallest element for...
asked 5 hours ago -
In python,write a function nameSet(first, last) that takes a
person's first and last names as input,...
asked 8 hours ago -
How do you think we should value management? Specifically how
might we try to determine MRPL...
asked 8 hours ago -
Suppose the Central Bank of Turkey starts to pay
interest on reserves. Under what circumstances this...
asked 8 hours ago