


Homework Answers
Given the market for blueberries in United States, a plentiful crop in Vermont will result in an increase in supply of blueberries in the United States, thus resulting in a rightward shift in the supply curve.
The new equilibrium is attained at point E', with lower equilibrium price and higher equilibrium quantity.
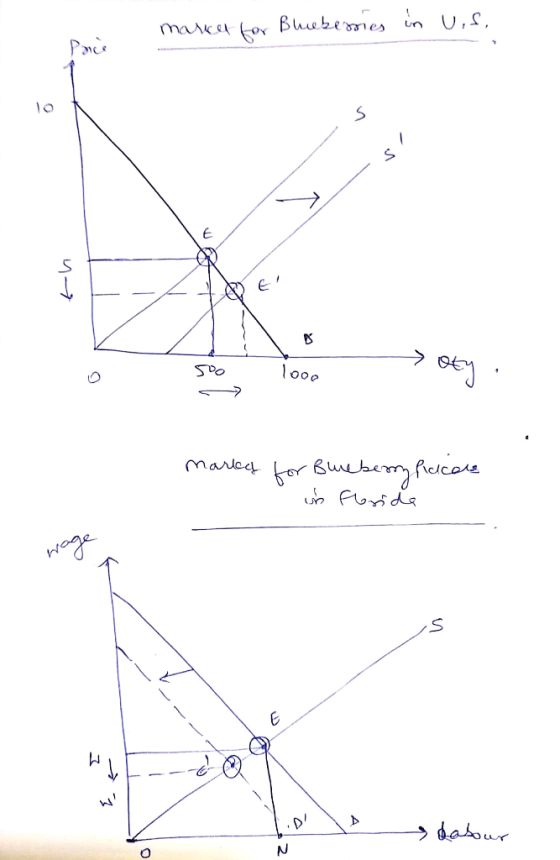
As a result of change in the price of blueberries, the demand for blueberry pickers will fall
As a result,w level for blueberry pickers in Florida will decline.
Add Answer to:
3. How changes in the market for output affect the demand for labor In this question,...
3. How changes in the market for output affect the demand for labor In this question,...
 3. How changes in the market for output affect the demand for labor In this question, you'll explore the effect of a flood in Vermont on the price of blueberries in the United States, as well as on the daily wages of blueberry pickers in Florida. Assume that blueberry buyers don't care whether their blueberries come from Vermont or Florida. On the following graph, show the effect the flood in Vermont has on the market for blueberries in the United...
3. How changes in the market for output affect the demand for labor In this question, you'll explore the effect of a plentiful crop in Vermont on the price of blueberries in the United States, as...
 3. How changes in the market for output affect the demand for labor In this question, you'll explore the effect of a plentiful crop in Vermont on the price of blueberries in the United States, as well as on the daily wages of blueberry pickers in Florida. Assume that blueberry buyers don't care whether their blueberries come from Vermont or Florida. On the following graph, show the effect the plentiful crop in Vermont has on the market for blueberries in the United...
NO HANDWRITING FOR GRAPHS, GRAPHS SHOULD BE CLEAR TO READ! 1. How changes in the goods...
 NO HANDWRITING FOR GRAPHS, GRAPHS SHOULD BE CLEAR TO READ!
1. How changes in the goods market affect the demand for labor In this question, you'll explore the effect of a change in demand for blueberries in the United States on the daily wages of blueberry pickers in Florida Assume that a new medical study shows that eating blueberries can cause cancer. On the following graph, show the effect of the new medical study on the market for blueberries in...
NO HANDWRITING FOR GRAPHS, GRAPHS SHOULD BE CLEAR TO READ!
1. How changes in the goods market affect the demand for labor In this question, you'll explore the effect of a change in demand for blueberries in the United States on the daily wages of blueberry pickers in Florida Assume that a new medical study shows that eating blueberries can cause cancer. On the following graph, show the effect of the new medical study on the market for blueberries in...
In this question, you'll explore the effect of a bad crop in Pennsylvania on the daily wages of strawberry pickers in California.
 3. How changes in the goods market affect the demand for labor In this question, you'll explore the effect of a bad crop in Pennsylvania on the daily wages of strawberry pickers in California. Assume that strawberry buyers don't care whether their strawberries come from Pennsylvania or California. A bad crop in Pennsylvania causes the _______ strawberries in the United States to _______ which is illustrated by a _______ shift of the curve. Show the effect of this shift on the following graph. Tool...
In this question, you'l explore the effect of a good weather season in Pennsylvania on the...
 In this question, you'l explore the effect of a good weather season in Pennsylvania on the price of strawberries e United States, as well as on the daily wages of strawberry pickers in California. Assume that strawberry buyers don't care whether their strawberries come from Pennsylvania o On the following graph, show the effect the good weather season in Pennsyivania has on the market for strawberries in the United States by shifting either the demand curve, the supply curve, or...
3. Consider the graph of a low-skill labor market, where D is the demand for low-skilled...
 3. Consider the graph of a low-skill labor market, where D is the demand for low-skilled workers by business firms, and S is the supply of native-bon U.S. workers who offer their labor services in the low-skill labor market. Show the shift that occurs with large-scale immigration of low-skilled workers into the United States. What is the effect on the wage on employment of native- born workers? Wage Rate ($ per hour) Employment (number of workers)
Problem #4: Own-price elasticity Suppose the market labor demand curve is given by LD = 20-(1/2,W...
 Problem #4: Own-price elasticity Suppose the market labor demand curve is given by LD = 20-(1/2,W and the market labor supply curve is given by LS 2 1. Graph the labor demand curve and the labor supply curve on the same graph (with L on the horizontal axis and W on the vertical axis, as we have done in class) 2. Determine the equilibrium employment (L and wage (W in this market 3. Now suppose the government implements a minimum...
Problem #4: Own-price elasticity Suppose the market labor demand curve is given by LD 20- (1/2)W...
 Problem #4: Own-price elasticity Suppose the market labor demand curve is given by LD 20- (1/2)W and the market labor supply curve is given by LS-2W 1. Graph the labor demand curve and the labor supply curve on the same graph (with L on the horizontal axis and W on the vertical axis, as we have done in class). 2. Determine the equilibrium employment (L") and wage (W") in this market. Now suppose the government implements a minimum wage (WM)...
Problem #4: Own-price elasticity Suppose the market labor demand curve is given by LD-20-(1/2)W and the...
 Problem #4: Own-price elasticity Suppose the market labor demand curve is given by LD-20-(1/2)W and the market labor supply curve is given by LS-2 1. Graph the labor demand curve and the labor supply curve on the same graph (with L on the horizontal axis and W on the vertical axis, as we have done in class) 2 Determine the equilibrium employment (L') and wage (W) in this market 3. Now suppose the government implements a minimum wage (WM) of...
Consider the following model of the labor market in the United States. Suppose that the labor...
Consider the following model of the labor market in the United States. Suppose that the labor market consists of two parts, a market for skilled workers and the market for unskilled workers, with different demand and supply curves for each as given below. The initial wage for skilled workers is $20 per hour; the initial wage for unskilled workers is $7 per hour. a. Draw the demand and supply curves for the two markets so that they intersect at the...
 3. How changes in the market for output affect the demand for labor In this question, you'll explore the effect of a flood in Vermont on the price of blueberries in the United States, as well as on the daily wages of blueberry pickers in Florida. Assume that blueberry buyers don't care whether their blueberries come from Vermont or Florida. On the following graph, show the effect the flood in Vermont has on the market for blueberries in the United...
 NO HANDWRITING FOR GRAPHS, GRAPHS SHOULD BE CLEAR TO READ!
1. How changes in the goods market affect the demand for labor In this question, you'll explore the effect of a change in demand for blueberries in the United States on the daily wages of blueberry pickers in Florida Assume that a new medical study shows that eating blueberries can cause cancer. On the following graph, show the effect of the new medical study on the market for blueberries in...
NO HANDWRITING FOR GRAPHS, GRAPHS SHOULD BE CLEAR TO READ!
1. How changes in the goods market affect the demand for labor In this question, you'll explore the effect of a change in demand for blueberries in the United States on the daily wages of blueberry pickers in Florida Assume that a new medical study shows that eating blueberries can cause cancer. On the following graph, show the effect of the new medical study on the market for blueberries in...
 In this question, you'l explore the effect of a good weather season in Pennsylvania on the price of strawberries e United States, as well as on the daily wages of strawberry pickers in California. Assume that strawberry buyers don't care whether their strawberries come from Pennsylvania o On the following graph, show the effect the good weather season in Pennsyivania has on the market for strawberries in the United States by shifting either the demand curve, the supply curve, or...
 3. Consider the graph of a low-skill labor market, where D is the demand for low-skilled workers by business firms, and S is the supply of native-bon U.S. workers who offer their labor services in the low-skill labor market. Show the shift that occurs with large-scale immigration of low-skilled workers into the United States. What is the effect on the wage on employment of native- born workers? Wage Rate ($ per hour) Employment (number of workers)
 Problem #4: Own-price elasticity Suppose the market labor demand curve is given by LD = 20-(1/2,W and the market labor supply curve is given by LS 2 1. Graph the labor demand curve and the labor supply curve on the same graph (with L on the horizontal axis and W on the vertical axis, as we have done in class) 2. Determine the equilibrium employment (L and wage (W in this market 3. Now suppose the government implements a minimum...
 Problem #4: Own-price elasticity Suppose the market labor demand curve is given by LD 20- (1/2)W and the market labor supply curve is given by LS-2W 1. Graph the labor demand curve and the labor supply curve on the same graph (with L on the horizontal axis and W on the vertical axis, as we have done in class). 2. Determine the equilibrium employment (L") and wage (W") in this market. Now suppose the government implements a minimum wage (WM)...
 Problem #4: Own-price elasticity Suppose the market labor demand curve is given by LD-20-(1/2)W and the market labor supply curve is given by LS-2 1. Graph the labor demand curve and the labor supply curve on the same graph (with L on the horizontal axis and W on the vertical axis, as we have done in class) 2 Determine the equilibrium employment (L') and wage (W) in this market 3. Now suppose the government implements a minimum wage (WM) of...
Most questions answered within 3 hours.
-
Kylie is a single mom with two dependent children,
Tanner, age 7 and Olivia, age 11....
asked 30 seconds ago -
Phosphorous + bromine = phosphorous tribromide. If 35.0 g of
bromine are reacted and 27.9 grams...
asked 1 hour ago -
Derive the long wavelength limit of the Planck energy density
distribution
asked 1 hour ago -
Calculate the pH of each of the following solutions.
0.50 M HBr
3.1×10⁻⁴ M KOH
4.2×10⁻⁵...
asked 4 hours ago -
For the year ended December 31, Depot Max’s cost of merchandise
sold was $85,600. Inventory at the...
asked 4 hours ago -
Week 10 - Professional Memo Assignment
Professional Memo Assignment
Your mission for this week, should you...
asked 4 hours ago -
Write a Python program that stores the data for each
player on the team, and it...
asked 5 hours ago -
In
the last 3 months, mike never knows when he is going to get his
allowance...
asked 5 hours ago -
Is Ca(OH)2 a Bronsted base, Lewis base, or both? Why?
asked 5 hours ago -
1A- Why don’t voters complain about U.S. tariffs on imported
sugar?
Because sugar is only a...
asked 5 hours ago -
Cash Payback Period
Primera Banco is evaluating two capital investment proposals for
a drive-up ATM kiosk,...
asked 5 hours ago -
Create a button in Swift (Xcode) that will create a charge,
create a charge using Stripe's...
asked 5 hours ago