


Homework Answers
1) 
(Supply of blueberries comes mainly from Vermont and Florida.Due to flood, quantity supplied of blueberries from Vermont will fall. Even though there is no change in quantity supplied from Florida, total quantity supplied in the US market will decrease due to the fall in the quantity supplied from Vermont. As a result supply curve will shift to Left as shown in the following diagram.
As a result of the shift, equilibrium price rises from 5 to 7 and equilibrium quantity falls from 250 to 150.)
2) First blank - Raise
(If supply of good is reduced, while demand remains unchanged , price of the good will raise. Following diagram will give you a more clear picture.

DD is the demand curve for blueberries and SS is the initial supply curve of blueberries. Equilibrium in the market is established by the intersection of SS and DD at point E. P is the equilibrium price and Q is the equilibrium quantity. Now, due to the fall in supply, SS shifts to left. S1S1 is the new supply curve. Intersection of S1S1 with DD at E1 leads to the establishment of a new equilibrium in the market. P1 is the new equilibrium price which is greater than previous equilibrium price P and Q1 is the new equilibrium quantity which is less than previous equilibrium quantity Q.
3) 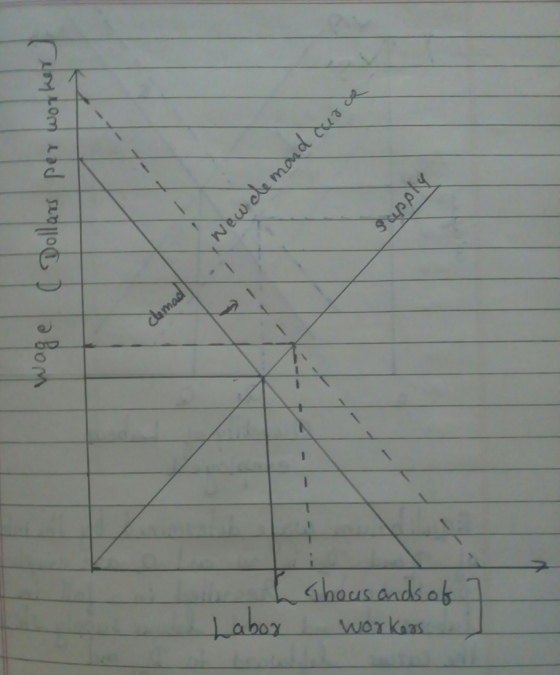
(Flood in Vermont results in a rise in price of blueberries.US consmers doesn't care whether the blueberries come from Vermont or blueberries. Therefore, in order to fulfill the additional demand created due to the fall in supply from Vermont and to reap the benefits from higher prices, producers from Florida will increase the supply of blueberries.ln order to increase the supply of blueberries, they will have to employ more labourers ( blueberry pickers). Therefore, demand for labour will raise in Florida and the labour demand curve will shift to right. Intersection of new labour demand curve with initial labour supply curve will lead to an increase in the quantity of blueberry pickers employed and an increase in wage rate for the blueberry pickers in Florida.)
4) Second blank - increase
( An increase in labour demand while the labour supply remains unchanged would lead to an increase in wage rate. following diagram will give you a better understanding.

DD represents the demand for blueberry pickers in . SS represents the supply of blueberry pickers. Initial equilibrium in the market is determined by the intersection of SS and DD at E. Equilibrium wage rate is W and Q amount of blueberry pickers are employed. As the demand for blueberry pickers increases , demand for labour curve shifts to right from DD to D1D1. Intersection of initial labour supply curve SS with D1D1 leads to at E1 establishes the new equilibrium in the market.W1 , the new wage rate is higher than W and Q1 the new amount of blueberry pickers employed is higher than Q.
Add Answer to:
3. How changes in the market for output affect the demand for labor In this question,...
3. How changes in the market for output affect the demand for labor In this question,...
 3. How changes in the market for output affect the demand for labor In this question, you'll explore the effect of a plentiful crop in Vermont on the price of blueberries in the United States, as well as on the daily wages of blueberry pickers in Florida. Assume that blueberry buyers don't care whether their blueberries come from Vermont or Florida On the following graph, show the effect the plentiful crop in Vermont has on the market for blueberries in...
3. How changes in the market for output affect the demand for labor In this question, you'll explore the effect of a plentiful crop in Vermont on the price of blueberries in the United States, as...
 3. How changes in the market for output affect the demand for labor In this question, you'll explore the effect of a plentiful crop in Vermont on the price of blueberries in the United States, as well as on the daily wages of blueberry pickers in Florida. Assume that blueberry buyers don't care whether their blueberries come from Vermont or Florida. On the following graph, show the effect the plentiful crop in Vermont has on the market for blueberries in the United...
NO HANDWRITING FOR GRAPHS, GRAPHS SHOULD BE CLEAR TO READ! 1. How changes in the goods...
 NO HANDWRITING FOR GRAPHS, GRAPHS SHOULD BE CLEAR TO READ!
1. How changes in the goods market affect the demand for labor In this question, you'll explore the effect of a change in demand for blueberries in the United States on the daily wages of blueberry pickers in Florida Assume that a new medical study shows that eating blueberries can cause cancer. On the following graph, show the effect of the new medical study on the market for blueberries in...
NO HANDWRITING FOR GRAPHS, GRAPHS SHOULD BE CLEAR TO READ!
1. How changes in the goods market affect the demand for labor In this question, you'll explore the effect of a change in demand for blueberries in the United States on the daily wages of blueberry pickers in Florida Assume that a new medical study shows that eating blueberries can cause cancer. On the following graph, show the effect of the new medical study on the market for blueberries in...
In this question, you'l explore the effect of a good weather season in Pennsylvania on the...
 In this question, you'l explore the effect of a good weather season in Pennsylvania on the price of strawberries e United States, as well as on the daily wages of strawberry pickers in California. Assume that strawberry buyers don't care whether their strawberries come from Pennsylvania o On the following graph, show the effect the good weather season in Pennsyivania has on the market for strawberries in the United States by shifting either the demand curve, the supply curve, or...
In this question, you'll explore the effect of a bad crop in Pennsylvania on the daily wages of strawberry pickers in California.
 3. How changes in the goods market affect the demand for labor In this question, you'll explore the effect of a bad crop in Pennsylvania on the daily wages of strawberry pickers in California. Assume that strawberry buyers don't care whether their strawberries come from Pennsylvania or California. A bad crop in Pennsylvania causes the _______ strawberries in the United States to _______ which is illustrated by a _______ shift of the curve. Show the effect of this shift on the following graph. Tool...
4. How changs in the goo ods markst affect the dumand for labor in this tuisbon,...
 4. How changs in the goo ods markst affect the dumand for labor in this tuisbon, you11?xplore the enact af ù draught in permsytvarna on the pria of tinbernes in the unilid Salis, is well aúen the daily wages Cunvi, the surpply curvie, ar both Supply The Following graph shows the daily market for strawbrry pickers in Califora dmavid curv, the Supply oni, ar bath Supply As à result of the change in the price of srawberris, the wage lvl...
3. Consider the graph of a low-skill labor market, where D is the demand for low-skilled...
 3. Consider the graph of a low-skill labor market, where D is the demand for low-skilled workers by business firms, and S is the supply of native-bon U.S. workers who offer their labor services in the low-skill labor market. Show the shift that occurs with large-scale immigration of low-skilled workers into the United States. What is the effect on the wage on employment of native- born workers? Wage Rate ($ per hour) Employment (number of workers)
In the supply & demand model of a market, we predict changes in the equilibrium price...
In the supply & demand model of a market, we predict changes in the equilibrium price and equilibrium quantity of a product associated with changes in the non-price determinants of either supply or demand. On a graph, when there is a change in a non-price determinant of demand, then we show the demand curve shifting to the right or left, depending on whether demand is increasing or decreasing. Similarly, when there is a change in a non-price determinant of supply,...
Problem #4: Own-price elasticity Suppose the market labor demand curve is given by LD = 20-(1/2,W...
 Problem #4: Own-price elasticity Suppose the market labor demand curve is given by LD = 20-(1/2,W and the market labor supply curve is given by LS 2 1. Graph the labor demand curve and the labor supply curve on the same graph (with L on the horizontal axis and W on the vertical axis, as we have done in class) 2. Determine the equilibrium employment (L and wage (W in this market 3. Now suppose the government implements a minimum...
Problem #4: Own-price elasticity Suppose the market labor demand curve is given by LD 20- (1/2)W...
 Problem #4: Own-price elasticity Suppose the market labor demand curve is given by LD 20- (1/2)W and the market labor supply curve is given by LS-2W 1. Graph the labor demand curve and the labor supply curve on the same graph (with L on the horizontal axis and W on the vertical axis, as we have done in class). 2. Determine the equilibrium employment (L") and wage (W") in this market. Now suppose the government implements a minimum wage (WM)...
 3. How changes in the market for output affect the demand for labor In this question, you'll explore the effect of a plentiful crop in Vermont on the price of blueberries in the United States, as well as on the daily wages of blueberry pickers in Florida. Assume that blueberry buyers don't care whether their blueberries come from Vermont or Florida On the following graph, show the effect the plentiful crop in Vermont has on the market for blueberries in...
 NO HANDWRITING FOR GRAPHS, GRAPHS SHOULD BE CLEAR TO READ!
1. How changes in the goods market affect the demand for labor In this question, you'll explore the effect of a change in demand for blueberries in the United States on the daily wages of blueberry pickers in Florida Assume that a new medical study shows that eating blueberries can cause cancer. On the following graph, show the effect of the new medical study on the market for blueberries in...
NO HANDWRITING FOR GRAPHS, GRAPHS SHOULD BE CLEAR TO READ!
1. How changes in the goods market affect the demand for labor In this question, you'll explore the effect of a change in demand for blueberries in the United States on the daily wages of blueberry pickers in Florida Assume that a new medical study shows that eating blueberries can cause cancer. On the following graph, show the effect of the new medical study on the market for blueberries in...
 In this question, you'l explore the effect of a good weather season in Pennsylvania on the price of strawberries e United States, as well as on the daily wages of strawberry pickers in California. Assume that strawberry buyers don't care whether their strawberries come from Pennsylvania o On the following graph, show the effect the good weather season in Pennsyivania has on the market for strawberries in the United States by shifting either the demand curve, the supply curve, or...
 4. How changs in the goo ods markst affect the dumand for labor in this tuisbon, you11?xplore the enact af ù draught in permsytvarna on the pria of tinbernes in the unilid Salis, is well aúen the daily wages Cunvi, the surpply curvie, ar both Supply The Following graph shows the daily market for strawbrry pickers in Califora dmavid curv, the Supply oni, ar bath Supply As à result of the change in the price of srawberris, the wage lvl...
 3. Consider the graph of a low-skill labor market, where D is the demand for low-skilled workers by business firms, and S is the supply of native-bon U.S. workers who offer their labor services in the low-skill labor market. Show the shift that occurs with large-scale immigration of low-skilled workers into the United States. What is the effect on the wage on employment of native- born workers? Wage Rate ($ per hour) Employment (number of workers)
 Problem #4: Own-price elasticity Suppose the market labor demand curve is given by LD = 20-(1/2,W and the market labor supply curve is given by LS 2 1. Graph the labor demand curve and the labor supply curve on the same graph (with L on the horizontal axis and W on the vertical axis, as we have done in class) 2. Determine the equilibrium employment (L and wage (W in this market 3. Now suppose the government implements a minimum...
 Problem #4: Own-price elasticity Suppose the market labor demand curve is given by LD 20- (1/2)W and the market labor supply curve is given by LS-2W 1. Graph the labor demand curve and the labor supply curve on the same graph (with L on the horizontal axis and W on the vertical axis, as we have done in class). 2. Determine the equilibrium employment (L") and wage (W") in this market. Now suppose the government implements a minimum wage (WM)...
Most questions answered within 3 hours.
-
A motor produces a torque of 0.25 N m at an angular velocity of
7200 revolutions...
asked 6 minutes ago -
***Please answer the below java question***
Are static methods inheritable? Can they be overridden?
asked 8 minutes ago -
In reaching her destination, a backpacker walks with an average
velocity of 1.13 m/s, due west....
asked 9 minutes ago -
Write two C programs that run a
server program and a client program concurrently.
Server program:...
asked 8 minutes ago -
Executive Program Practical Connection Assignment
Subject : Operations Security.
Assignment:
Provide a reflection of at least...
asked 18 minutes ago -
Every time Casey is at bat he has a 0.4 probability of
getting on base (assume...
asked 26 minutes ago -
The Walston Company is to be liquidated and has the following
liabilities:
Income taxes
$
9,400...
asked 33 minutes ago -
If
the more comprehensive data is available in MEPS, why does the NHIS
still exist? How...
asked 54 minutes ago -
Koo argues that the Japanese economy in the 1990s suffered from
a balance sheet recession. What...
asked 47 minutes ago -
Automobile mechanics conduct diagnosis tests on 150 new cars of
particular make and model to determine...
asked 42 minutes ago -
11) Find the proceeds of a 5 year non-interest
bearing note for $6500 discounted 2.5 years...
asked 48 minutes ago -
Required: Prepare the consolidated financial statements of
Griffin Ltd at 30 June 2019.
Griffin Ltd is...
asked 57 minutes ago