

Homework Answers
Add Answer to:
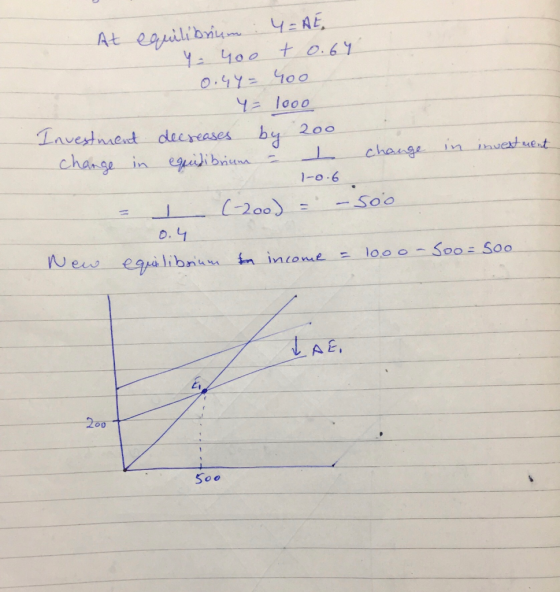
please do all questions correctly
do the graph as well please
Refer to the diagram to...
The graph to the right shows a 45°-line (Keynesian cross) diagram. The economy is currently in...
 The graph to the right shows a 45°-line (Keynesian cross) diagram. The economy is currently in macroeconomic equilibrium at output level Y. Real aggregate expenditures, AE Y = AE Suppose that the price level decreases. 1) Use the line tool to show a possible position for the new aggregate expenditures line. Label this line AE,. AEO Note: if you are not prompted for a label, you have used the wrong drawing tool. 2) Use the point drawing tool to show...
Income Determination 2,000 You are given the following data concerning Freedonia, a legendary country: • Consumption...
 Income Determination 2,000 You are given the following data concerning Freedonia, a legendary country: • Consumption function: C=150 +0.75Y • Investment function: I = 150 • Aggregate expenditure function: AEC +1 • Equilibrium: AE = Y Graph the following: 1.) Using the line drawing tool draw the consumption function. Label your line 'C 2.) Using the line drawing tool, draw the aggregate expenditure function Label your line 'AE 3.) Using the point drawing tool, Identify the equilibrium level of income....
The following info rmation is available for a count Equilibrium and Fiscal Policy Consumption Function: C...
 The following info rmation is available for a count Equilibrium and Fiscal Policy Consumption Function: C = 100 + 0.8(Y-T) 3,2 Net Taxes: T = 250 0 Planned Investment: I 200 2,8 Government Spending: G 300 The graph of the consumption function is shown as C 1.) Using the line drawing tool, draw the aggregate expenditure line. Label it AEt 2.) Using the point drawing tool, identify the equilibrium point. Label it E. 2, 3.) Using the line drawing tool,...
i just need the graph An economy is described as follows: C = 3,000 + 0.5...
i just need the graph An economy is described as follows: C = 3,000 + 0.5 (Y – T) I p = 1,500 G = 2,500 NX = 200 T = 2,000 Y* = 12,000 a. For the economy described above, find autonomous expenditure, the multiplier, short-run equilibrium output, and the output gap. Instructions: Enter your responses as whole numbers. Autonomous expenditure: Multiplier: Short-run equilibrium output: Output gap: b. Illustrate this economy’s short-run equilibrium on a Keynesian cross diagram. Instructions: On...
This Question: 1 pt 11 of 30 This In the graph on the right the economy...
 This Question: 1 pt 11 of 30 This In the graph on the right the economy is in long-run equilibrium at point A Now, assume that there is an unexpected increase in the price of oil. 1) Use the line drawing tool to show the resulting short-run equilibrium on your diagram. Label any new aggregate demand or aggregate supply curve as AD, SRAS, LRAS, p riate 2.) Use the point drawing tool to locate the new short run equilibrium point...
Using an income-expenditure diagram, use the infinite line and double-drop line tools to show the economy...
Using an income-expenditure diagram, use the infinite line and double-drop line tools to show the economy in equilibrium and mark that point E1. Use the copy tool to illustrate the impact of a decrease in lump-sum taxes of $150 billion on planned aggregate spending. Assume that the marginal propensity to consume is 0.5. Label the new aggregate expenditure curve AE2. Then, use the double-drop line tool to plot and label the new equilibrium (E2).
LRAS In the graph to the right illustrating the AD-AS model, assume the economy was in...
 LRAS In the graph to the right illustrating the AD-AS model, assume the economy was in equilibrium at point E1. Then, assume there was a decline in spending on new houses. Where does short-run equilibrium occur? Where does long-run equilibrium occur? 1.) Using the point drawing tool, plot the point that represents short-run equilibrium. Label this point E2. Price level, P. SRAS a SRAS2E1 2.) Using the point drawing tool, plot the point that represents long-run equilibrium. Label this point...
supply curve to shift leftward to SRAS, as shown in the graph at right. The economy is currently in short-run equilibrium at point E, and the reduction in supply is expected to be permanent. LRAS...
 supply curve to shift leftward to SRAS, as shown in the graph at right. The economy is currently in short-run equilibrium at point E, and the reduction in supply is expected to be permanent. LRAS SRAS SRAS 1.) Using the line drawing and/or 3-point curved line drawing tool, show the adjustment to long-run equilibrium in this situation. Properly label your new curve(s). 2.) Using the point drawing tool, identify the new long-run equilibrium point and label the point 'E2 Carefully...
An economy is described as follows: C = 400 + 0.6(Y – T) I p =...
An economy is described as follows: C = 400 + 0.6(Y – T) I p = 200 G = 200 NX = 60 T = 100 Y* = 2,100 a. For the economy described above, find autonomous expenditure, the multiplier, short-run equilibrium output, and the output gap. Instructions: Enter your responses as absolute values. Autonomous expenditure: Multiplier: Short-run equilibrium output: There is (Click to select) a recessionary an expansionary no output gap in the amount of . b. Illustrate this economy’s short-run equilibrium on a...
10 The following graph shows aggregate demand and short run aggregate supply 1.) Use the line...
 10 The following graph shows aggregate demand and short run aggregate supply 1.) Use the line drawing tool to show the effect of an unexpected decrease in the price of oil. Property label this line. 2.) Use the point drawing tool to show the new equilibrium price level and real GDP. Label this point 'B'. Caretaly follow the instructions above, and only draw the required objects. LRAS, SRA Prevel A "ADO Re GOPY
 The graph to the right shows a 45°-line (Keynesian cross) diagram. The economy is currently in macroeconomic equilibrium at output level Y. Real aggregate expenditures, AE Y = AE Suppose that the price level decreases. 1) Use the line tool to show a possible position for the new aggregate expenditures line. Label this line AE,. AEO Note: if you are not prompted for a label, you have used the wrong drawing tool. 2) Use the point drawing tool to show...
 Income Determination 2,000 You are given the following data concerning Freedonia, a legendary country: • Consumption function: C=150 +0.75Y • Investment function: I = 150 • Aggregate expenditure function: AEC +1 • Equilibrium: AE = Y Graph the following: 1.) Using the line drawing tool draw the consumption function. Label your line 'C 2.) Using the line drawing tool, draw the aggregate expenditure function Label your line 'AE 3.) Using the point drawing tool, Identify the equilibrium level of income....
 The following info rmation is available for a count Equilibrium and Fiscal Policy Consumption Function: C = 100 + 0.8(Y-T) 3,2 Net Taxes: T = 250 0 Planned Investment: I 200 2,8 Government Spending: G 300 The graph of the consumption function is shown as C 1.) Using the line drawing tool, draw the aggregate expenditure line. Label it AEt 2.) Using the point drawing tool, identify the equilibrium point. Label it E. 2, 3.) Using the line drawing tool,...
 This Question: 1 pt 11 of 30 This In the graph on the right the economy is in long-run equilibrium at point A Now, assume that there is an unexpected increase in the price of oil. 1) Use the line drawing tool to show the resulting short-run equilibrium on your diagram. Label any new aggregate demand or aggregate supply curve as AD, SRAS, LRAS, p riate 2.) Use the point drawing tool to locate the new short run equilibrium point...
 LRAS In the graph to the right illustrating the AD-AS model, assume the economy was in equilibrium at point E1. Then, assume there was a decline in spending on new houses. Where does short-run equilibrium occur? Where does long-run equilibrium occur? 1.) Using the point drawing tool, plot the point that represents short-run equilibrium. Label this point E2. Price level, P. SRAS a SRAS2E1 2.) Using the point drawing tool, plot the point that represents long-run equilibrium. Label this point...
 supply curve to shift leftward to SRAS, as shown in the graph at right. The economy is currently in short-run equilibrium at point E, and the reduction in supply is expected to be permanent. LRAS SRAS SRAS 1.) Using the line drawing and/or 3-point curved line drawing tool, show the adjustment to long-run equilibrium in this situation. Properly label your new curve(s). 2.) Using the point drawing tool, identify the new long-run equilibrium point and label the point 'E2 Carefully...
 10 The following graph shows aggregate demand and short run aggregate supply 1.) Use the line drawing tool to show the effect of an unexpected decrease in the price of oil. Property label this line. 2.) Use the point drawing tool to show the new equilibrium price level and real GDP. Label this point 'B'. Caretaly follow the instructions above, and only draw the required objects. LRAS, SRA Prevel A "ADO Re GOPY
Most questions answered within 3 hours.
-
In order for corporations to behave ethically, they must,
ultimately, give up the profit motive.
...
asked 42 seconds from now -
Blue Spruce Corp. owns equipment that cost $63,400 when
purchased on January 1, 2017. It has...
asked 19 minutes ago -
A lottery exists where balls numbered 1 to 17 are placed in an
urn. To win,...
asked 1 hour ago -
Please explain steps:
An 80 kg swimmer steps off a platform 10 m above the water...
asked 1 hour ago -
26) Briefly describe, using words or simple diagrams, the
chemiosmotic theory for coupling oxidation to phosphorylation...
asked 3 hours ago -
Suppose that XX is a random variable with mean 16 and standard
deviation 5 . Also...
asked 4 hours ago -
Calculate the number density of argon gas at a temperature of
24C and a pressure of...
asked 7 hours ago -
Alternative
Classification
How to Estimate
Probabilities from Data? ( For continuous Attributes)
And How to generate...
asked 7 hours ago -
An explosion breaks a 20.0-kg object into three parts. The
object is initially moving at a...
asked 8 hours ago -
Calculate the approximate number of residues of Rubisco, which
is involved in carbon fixation in plants,...
asked 9 hours ago -
Other decisions about scientific claims can have a much broader
impact.ENERGYarrow-10x10.png, environment, health, security - all...
asked 10 hours ago -
I need to write a research paper and work cited about this
topic: The United States...
asked 10 hours ago