
Homework Answers
Add Answer to:
10 The following graph shows aggregate demand and short run aggregate supply 1.) Use the line...
supply curve to shift leftward to SRAS, as shown in the graph at right. The economy is currently in short-run equilibrium at point E, and the reduction in supply is expected to be permanent. LRAS...
 supply curve to shift leftward to SRAS, as shown in the graph at right. The economy is currently in short-run equilibrium at point E, and the reduction in supply is expected to be permanent. LRAS SRAS SRAS 1.) Using the line drawing and/or 3-point curved line drawing tool, show the adjustment to long-run equilibrium in this situation. Properly label your new curve(s). 2.) Using the point drawing tool, identify the new long-run equilibrium point and label the point 'E2 Carefully...
This Question: 1 pt 11 of 30 This In the graph on the right the economy...
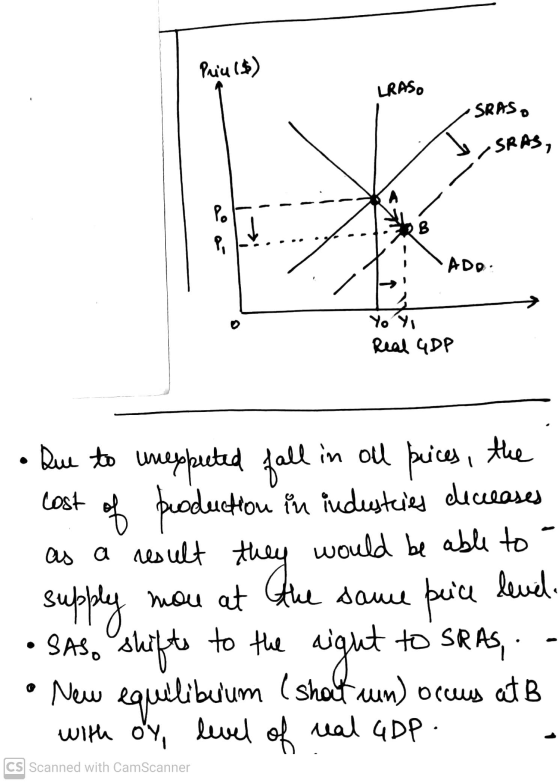
 This Question: 1 pt 11 of 30 This In the graph on the right the economy is in long-run equilibrium at point A Now, assume that there is an unexpected increase in the price of oil. 1) Use the line drawing tool to show the resulting short-run equilibrium on your diagram. Label any new aggregate demand or aggregate supply curve as AD, SRAS, LRAS, p riate 2.) Use the point drawing tool to locate the new short run equilibrium point...
The short-run aggregate supply curve is shown at right. Suppose OPEC decides to reduce oil production....
 The short-run aggregate supply curve is shown at right. Suppose OPEC decides to reduce oil production. Using the line drawing tool, draw and label a new short-run aggregate supply. Carefully follow the instructions above, and only follow the required object. The impact would result in Price Level AD O A. inflation: a lower price level and lower unemployment. O B. recession: a lower price level and higher unemployment. O C. stagflation: a higher price level and higher unemployment. OD. depression:...
The graph below depicts the aggregate demand, Irrun aggregate supply, and short-run aggregate supply curves for...
 The graph below depicts the aggregate demand, Irrun aggregate supply, and short-run aggregate supply curves for the United States at an initial long-run macroeconomic equilibrium Price level] (P) LRAS SRAS Real GDP Consider a situation in which two things happen simultaneously: there is a deterioration of institutions, and the federal government massively increases spending. Which of the graphs below illustrates the shifts in this model given this situation? Price level Price level (P) (P) URAS LRAS, LRAS SRAS SRAS SRAS...
Text Problem 10-15 Question Help The figure to the right shows an economy in an initial...
 Text Problem 10-15 Question Help The figure to the right shows an economy in an initial long-run equilibrium at point A LRAS, a. Using the line drawing tool, show how, if at all the equilibrium real GDP and the long-run equilibrium price level are affected by a decrease in the value of the home currency in terms of the currencies of other nations. Property label this line. Carefully follow the instructions above, and only draw the required objects Price Level...
The graph to the right shows a situation in which the economy was in equilibrium at potential GDP (at point A) when the...
 The graph to the right shows a situation in which the economy was in equilibrium at potential GDP (at point A) when the demand for housing sharply declined. What actions can the federal government take to move the economy back to potential GDP? LRAS SRAS SRAS O A. Increase the money supply. B. Increase government spending or decrease taxes. O C. Decrease government spending or increase taxes. O D. Both A and B. Price level 1.) Use the line drawing...
L in in the following table shows what the situation will be in 2015 if the Price Level (CP) GDP ...
 l in in the following table shows what the situation will be in 2015 if the Price Level (CP) GDP Real GDP Price Level 2014 $1.55 trillion $1.55 trilion 2015 $1.61 trillion $1.55 trillion 124 Draw an aggregate demand and aggregate supply graph to illustrate the effects of Parliament's policy Assume that policy does not affect LRAS 1.) Use the line drawing tool to draw the LRAS curves for 2014 and 2015. Respectively label these curves LRAS2014 and 'LRAS2015 2.)...
The table shows Aggregate Demand and Short-run Aggregate Supply for a country in which Potential GDP...
The table shows Aggregate Demand and Short-run Aggregate Supply for a country in which Potential GDP is $1,050 billion Price Level Real GDP Demanded Real GDP Supplied 100 $1,150 $1,050 110 $1,100 $1,100 120 $1,050 $1,150 130 $1,000 $1,200 140 $950 $1,250 150 $900 $1,300 160 $850 $1,350 Graph the Aggregate Demand and Short-run Aggregate Supply curves Does this country have an inflationary gap or a recessionary gap? What is the magnitude of the gap as a % of Potential...
The figure to the right shows an economy in an initial long-run equilibrium at point A...
 The figure to the right shows an economy in an initial long-run equilibrium at point A a Using the line drawing tool show how, if at all the equilibrium real GDP and the long run equilibrium price level are affected by a decrease in the value of the home currency in terms of the currencies of other nations Properly label this line Carefully follow the instructions above and only draw the required objects b. According to your graph, the equilibrium...
Using the aggregate demand (AD), the short-run aggregate supply (SRAS), and the long-run aggregate supply (LRAS)...
Using the aggregate demand (AD), the short-run aggregate supply (SRAS), and the long-run aggregate supply (LRAS) curves, briefly explain how an open market purchase will affect the equilibrium price level (P) and real output (Y) in the short run. Assume the economy is initially in a recession?
 supply curve to shift leftward to SRAS, as shown in the graph at right. The economy is currently in short-run equilibrium at point E, and the reduction in supply is expected to be permanent. LRAS SRAS SRAS 1.) Using the line drawing and/or 3-point curved line drawing tool, show the adjustment to long-run equilibrium in this situation. Properly label your new curve(s). 2.) Using the point drawing tool, identify the new long-run equilibrium point and label the point 'E2 Carefully...
 This Question: 1 pt 11 of 30 This In the graph on the right the economy is in long-run equilibrium at point A Now, assume that there is an unexpected increase in the price of oil. 1) Use the line drawing tool to show the resulting short-run equilibrium on your diagram. Label any new aggregate demand or aggregate supply curve as AD, SRAS, LRAS, p riate 2.) Use the point drawing tool to locate the new short run equilibrium point...
 The short-run aggregate supply curve is shown at right. Suppose OPEC decides to reduce oil production. Using the line drawing tool, draw and label a new short-run aggregate supply. Carefully follow the instructions above, and only follow the required object. The impact would result in Price Level AD O A. inflation: a lower price level and lower unemployment. O B. recession: a lower price level and higher unemployment. O C. stagflation: a higher price level and higher unemployment. OD. depression:...
 The graph below depicts the aggregate demand, Irrun aggregate supply, and short-run aggregate supply curves for the United States at an initial long-run macroeconomic equilibrium Price level] (P) LRAS SRAS Real GDP Consider a situation in which two things happen simultaneously: there is a deterioration of institutions, and the federal government massively increases spending. Which of the graphs below illustrates the shifts in this model given this situation? Price level Price level (P) (P) URAS LRAS, LRAS SRAS SRAS SRAS...
 Text Problem 10-15 Question Help The figure to the right shows an economy in an initial long-run equilibrium at point A LRAS, a. Using the line drawing tool, show how, if at all the equilibrium real GDP and the long-run equilibrium price level are affected by a decrease in the value of the home currency in terms of the currencies of other nations. Property label this line. Carefully follow the instructions above, and only draw the required objects Price Level...
 The graph to the right shows a situation in which the economy was in equilibrium at potential GDP (at point A) when the demand for housing sharply declined. What actions can the federal government take to move the economy back to potential GDP? LRAS SRAS SRAS O A. Increase the money supply. B. Increase government spending or decrease taxes. O C. Decrease government spending or increase taxes. O D. Both A and B. Price level 1.) Use the line drawing...
 l in in the following table shows what the situation will be in 2015 if the Price Level (CP) GDP Real GDP Price Level 2014 $1.55 trillion $1.55 trilion 2015 $1.61 trillion $1.55 trillion 124 Draw an aggregate demand and aggregate supply graph to illustrate the effects of Parliament's policy Assume that policy does not affect LRAS 1.) Use the line drawing tool to draw the LRAS curves for 2014 and 2015. Respectively label these curves LRAS2014 and 'LRAS2015 2.)...
 The figure to the right shows an economy in an initial long-run equilibrium at point A a Using the line drawing tool show how, if at all the equilibrium real GDP and the long run equilibrium price level are affected by a decrease in the value of the home currency in terms of the currencies of other nations Properly label this line Carefully follow the instructions above and only draw the required objects b. According to your graph, the equilibrium...
Most questions answered within 3 hours.
-
Write the ionic equations for the first stage of salts
hydrolysis.
Anion, Cation?
Na2S
NiSO4
K2SO4...
asked 1 hour ago -
suppose there is a normally distributed population with a mean of
250 and a standard deviation...
asked 1 hour ago -
Question Three
Suppose you as project manager are using the Waterfall
development methodology on a large...
asked 2 hours ago -
Which statement is not true about welfare in Canada?
A.Benefits typically vary based on one's ability...
asked 3 hours ago -
Please help me with FLOWCHART and UML diagram for class,
thank you!
#include <iostream>
#include <fstream>...
asked 4 hours ago -
3. Describe the “logic circuit” of the Lac operon. Which
proteins are bound or not to...
asked 4 hours ago -
Ayesha’s adjusted gross income is $60,000 in 2019. She donated a
piece of artwork with a...
asked 4 hours ago -
For Dijkstra’s shortest path algorithm:
a. Give the Big-O time for Dijkstra’s shortest path algorithm
and...
asked 4 hours ago -
Phosphorus violates the 'octet rule' in biological molecules,
forming more covalent bonds than expected based on...
asked 4 hours ago -
A 1.3 eV electron has a 10-4 probability of tunneling
through a 2.4 eV potential barrier....
asked 4 hours ago -
What is the one ingredient that is common to being successful
with all stakeholders?
profit
trust...
asked 4 hours ago -
Write an assembly language 32 bit program that reads in lines of
text by a .txt...
asked 4 hours ago