
Homework Answers
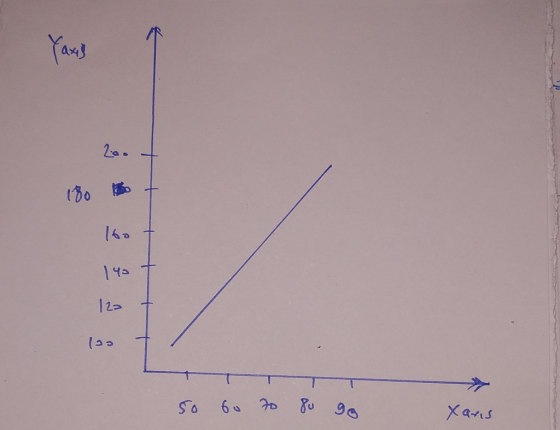
Here from the given values we can see that for both X and y the value is increasing
For X, it is increasing at a constant difference of 10
For y it is increasing at a constant difference of 30
It shows that both are upward sloping and straight line in nature
If the value decrease in nature then there will be a downward straight line
So the only correct answer here is option B
Add Answer to:
Point X 50 60 70 Y 100 130 160 190 80 Refer to Exhibit 1-2. Based...
Point X Y A 50 100 B 60 130 C 70 160 D 80 190 Refer...
Point X Y A 50 100 B 60 130 C 70 160 D 80 190 Refer to Exhibit 1-2. Based on the data provided in this table, if these data were plotted in a two-variable diagram the result would be ______________ sloping ____________________. A.an upward; (straight) line B.a downward; (nonlinear) curve C.none of the above D.a downward; (straight) line E.an upward; (nonlinear) curve
Point A 50 100 130 B C 60 70 160 80 190 Refer to Exhibit 1-2....
 Point A 50 100 130 B C 60 70 160 80 190 Refer to Exhibit 1-2. According to the data provided in this table, what is the slope of the line between points A and B, if these data were graphed with X on the horizontal axis and Y on the vertical axis? none of these options 6.00 3.00 -0.33 0 -3.00
20 30 40 50 60 70 80 99 100 110 120 130 140 150 160 170...
 20 30 40 50 60 70 80 99 100 110 120 130 140 150 160 170 180 190 259 260 270 280 290 300 310 320 330 340 350 360 370 380 390 400 410 420 430 490 500 51 52 53 545 QUESTION 47 Ben bought a house for $500,000. The bank will make a mortgage loan with 10% down, 30 years at 3% annual interest rate with monthly payments. What will be Ben's monthly payment? $1,250.00 $1,388.89 O...
Suggest a composition for the halogen compound whose mass spectrum is shown below and assign the labeled peaks. 127 100 173 160 158 162 25 48 TITTHTT 160 170 91 208 79 35 160 173 30 40 50 60 70 80 90...
 Suggest a composition for the halogen compound whose mass
spectrum is shown below and assign the labeled peaks.
127 100 173 160 158 162 25 48 TITTHTT 160 170 91 208 79 35 160 173 30 40 50 60 70 80 90 100 110 120 130 140 150 160 170 180 190 200 210 m/z
127 100 173 160 158 162 25 48 TITTHTT 160 170 91 208 79 35 160 173 30 40 50 60 70 80 90 100...
Suggest a composition for the halogen compound whose mass
spectrum is shown below and assign the labeled peaks.
127 100 173 160 158 162 25 48 TITTHTT 160 170 91 208 79 35 160 173 30 40 50 60 70 80 90 100 110 120 130 140 150 160 170 180 190 200 210 m/z
127 100 173 160 158 162 25 48 TITTHTT 160 170 91 208 79 35 160 173 30 40 50 60 70 80 90 100...
$20 ATC 15 10 5 0 10 20 30 40 50 Quantity 60 70 80 Refer...
 $20 ATC 15 10 5 0 10 20 30 40 50 Quantity 60 70 80 Refer to the diagram showing the average total cost curve for a purely competitive firm. At the long-run equilibrium level of output, this firm's economic profit: is zero is $400 O is $200 cannot be determined from the information provided.
eBook Video Consider the following data for two variables, z and y. i 135 110 130 145 175 160 120 i 145 100 120 120 130 130 110 a. Consider the four scatter diagrams below. 1. 120 100 80 ...
 eBook Video Consider the following data for two variables, z and y. i 135 110 130 145 175 160 120 i 145 100 120 120 130 130 110 a. Consider the four scatter diagrams below. 1. 120 100 80 " " 60 40 20 110-120 130 149-150 160 170 2. 120 100 80 60 40 20 110-120-130 140 150 160 170 3. 120 100 80 60 40 20 110一一120一一130 -149 130-100-170 120 100 80 60 40 20 130-140-150一一160一一1zo___ 110 120...
r 170 160+ 150 140+ 130 - 120 110 100+ 90 Supply 80- 70 60+ SO...
 r 170 160+ 150 140+ 130 - 120 110 100+ 90 Supply 80- 70 60+ SO 40- Demand 30 20- 10- 2 4 6 8 10 12 14 16 18 20 22 24 26 28 30 Quantity of Loanable Funds Suppose the market for loanable funds opened up to international borrowers and savers. Further suppose that the real interest rate worldwide is 120 basis points (100 basis points = 1%). Would the gains from trade end up with the households...
Exhibit 1-3 Point X Y A 5 8 B 10 6 C 15 4 D 20...
Exhibit 1-3 Point X Y A 5 8 B 10 6 C 15 4 D 20 2 Refer to Exhibit 1-3. According to the data provided in this table, what is the slope of the line between points A and B, if these data were graphed with X on the horizontal axis and Y on the vertical axis? a) -0.40 b) -2.50 c) 0.40 d) 2.50 e) none of the above
QUESTION 1 Figure 2-5 100 90 80 70 60 50 40 30 20 10 10 20...
 QUESTION 1 Figure 2-5 100 90 80 70 60 50 40 30 20 10 10 20 30 40 50 60 70 80 washe Refer to Figure 2-5. It is possible for this economy to produce O a. 60 dryers and 50 washers. b. 60 dryers and 60 washers. c. 80 dryers and 50 washers. O d. All of the above.
Question 4 Figure 2-16 120 110+ A 100 C 90 D 80 70 60 50 40...
 Question 4 Figure 2-16 120 110+ A 100 C 90 D 80 70 60 50 40 30 20 10 10 20 30 40 60 60 70 80 90 100 Widgets Refer to Figure 2-16. The opportunity cost of obtaining approximately 20 additional gadgets by moving from point B to point C is O 0 widgets. 10 widgets. 20 widgets none of the above; the economy cannot move from pointB to point C.
 Point A 50 100 130 B C 60 70 160 80 190 Refer to Exhibit 1-2. According to the data provided in this table, what is the slope of the line between points A and B, if these data were graphed with X on the horizontal axis and Y on the vertical axis? none of these options 6.00 3.00 -0.33 0 -3.00
 20 30 40 50 60 70 80 99 100 110 120 130 140 150 160 170 180 190 259 260 270 280 290 300 310 320 330 340 350 360 370 380 390 400 410 420 430 490 500 51 52 53 545 QUESTION 47 Ben bought a house for $500,000. The bank will make a mortgage loan with 10% down, 30 years at 3% annual interest rate with monthly payments. What will be Ben's monthly payment? $1,250.00 $1,388.89 O...
 Suggest a composition for the halogen compound whose mass
spectrum is shown below and assign the labeled peaks.
127 100 173 160 158 162 25 48 TITTHTT 160 170 91 208 79 35 160 173 30 40 50 60 70 80 90 100 110 120 130 140 150 160 170 180 190 200 210 m/z
127 100 173 160 158 162 25 48 TITTHTT 160 170 91 208 79 35 160 173 30 40 50 60 70 80 90 100...
Suggest a composition for the halogen compound whose mass
spectrum is shown below and assign the labeled peaks.
127 100 173 160 158 162 25 48 TITTHTT 160 170 91 208 79 35 160 173 30 40 50 60 70 80 90 100 110 120 130 140 150 160 170 180 190 200 210 m/z
127 100 173 160 158 162 25 48 TITTHTT 160 170 91 208 79 35 160 173 30 40 50 60 70 80 90 100...
 $20 ATC 15 10 5 0 10 20 30 40 50 Quantity 60 70 80 Refer to the diagram showing the average total cost curve for a purely competitive firm. At the long-run equilibrium level of output, this firm's economic profit: is zero is $400 O is $200 cannot be determined from the information provided.
 eBook Video Consider the following data for two variables, z and y. i 135 110 130 145 175 160 120 i 145 100 120 120 130 130 110 a. Consider the four scatter diagrams below. 1. 120 100 80 " " 60 40 20 110-120 130 149-150 160 170 2. 120 100 80 60 40 20 110-120-130 140 150 160 170 3. 120 100 80 60 40 20 110一一120一一130 -149 130-100-170 120 100 80 60 40 20 130-140-150一一160一一1zo___ 110 120...
 r 170 160+ 150 140+ 130 - 120 110 100+ 90 Supply 80- 70 60+ SO 40- Demand 30 20- 10- 2 4 6 8 10 12 14 16 18 20 22 24 26 28 30 Quantity of Loanable Funds Suppose the market for loanable funds opened up to international borrowers and savers. Further suppose that the real interest rate worldwide is 120 basis points (100 basis points = 1%). Would the gains from trade end up with the households...
 QUESTION 1 Figure 2-5 100 90 80 70 60 50 40 30 20 10 10 20 30 40 50 60 70 80 washe Refer to Figure 2-5. It is possible for this economy to produce O a. 60 dryers and 50 washers. b. 60 dryers and 60 washers. c. 80 dryers and 50 washers. O d. All of the above.
 Question 4 Figure 2-16 120 110+ A 100 C 90 D 80 70 60 50 40 30 20 10 10 20 30 40 60 60 70 80 90 100 Widgets Refer to Figure 2-16. The opportunity cost of obtaining approximately 20 additional gadgets by moving from point B to point C is O 0 widgets. 10 widgets. 20 widgets none of the above; the economy cannot move from pointB to point C.
Most questions answered within 3 hours.
-
Networks have a ‘dual' property’. They provide information that
allows us to estimate our location. But...
asked 1 minute ago -
Using Mathematica programming -- I need the program to run 8
times and get 8 different...
asked 8 minutes ago -
The survival to sexual maturity rates for genotypes A1A1, A1A2,
and A2A2 are 90%, 85%, &...
asked 3 minutes ago -
1-Imagine you're named an Economic Advisor to the
president of a very poor and backward country...
asked 7 minutes ago -
1.Explain the diffrence between equity finance and
debt finance with example?
By which one sales bonds...
asked 10 minutes ago -
Discuss "Condensation Reactions" giving at least two examples. Your
explanation should include relevant mechanisms and references...
asked 11 minutes ago -
You own a one-year call option to buy one acre of Los Angeles
real estate. The...
asked 20 minutes ago -
calculate [H3O+], pH, [OH], and pOH, .30M HNO3 solution at 25 C.
Ka= very high
asked 29 minutes ago -
What are the definitions of a (security) risk assessment in the
textbook and in Appendix B...
asked 27 minutes ago -
Are there commercial operations using technique magnets for
separation technique? If yes, how much material can...
asked 27 minutes ago -
What type of tools are available to help you evalute
analyze strategic factors? What would you...
asked 29 minutes ago -
Which complex in the electron transport chain does not
contribute to the proton gradient across the...
asked 46 minutes ago