Please show your work. God bless

Homework Answers
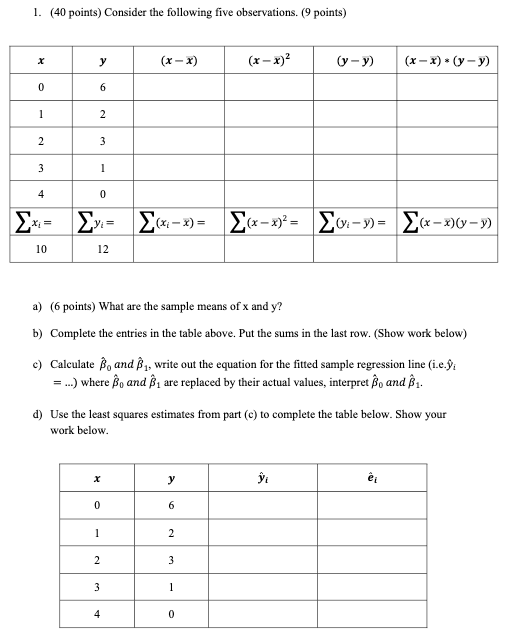
a) sample mean of x, x̄= Σx/n = 10/5 = 2
sample mean of y, ȳ = Σy/n = 12/5 =
2.4
b)
| x | y | (x-x̄) | (x-x̄)2 | (y-ȳ) | (y-ȳ)2 | (x-x̄)*(y-ȳ) |
| 0 | 6 | -2 | 4 | 3.6 | 12.96 | -7.2 |
| 1 | 2 | -1 | 1 | -0.4 | 0.16 | 0.4 |
| 2 | 3 | 0 | 0 | 0.6 | 0.36 | 0 |
| 3 | 1 | 1 | 1 | -1.4 | 1.96 | -1.4 |
| 4 | 0 | 2 | 4 | -2.4 | 5.76 | -4.8 |
| Σx = | Σy = | Σ(x-x̄) = | Σ(x-x̄)2 = | Σ(y-ȳ) = | Σ(y-ȳ)2 = | Σ (x-x̄)(y-ȳ) = |
| 10 | 12 | 0 | 10 | 0 | 21.2 | -13 |
c) b1 = Σ (x-x̄)(y-ȳ) / Σ(x-x̄)2 = -13/10
= -1.3
b0 = ȳ - b1x̄ = 2.4 - (-1.3*2) = 5
thus ŷi = 5 -1.3*xi
d)
| x | y | ŷi = 5 -1.3*xi | êi = yi-ŷi |
| 0 | 6 | 5 | 1 |
| 1 | 2 | 3.7 | -1.7 |
| 2 | 3 | 2.4 | 0.6 |
| 3 | 1 | 1.1 | -0.1 |
| 4 | 0 | -0.2 | 0.2 |
Add Answer to:
Please show your work. God bless
1. (40 points) Consider the following five observations. (9 points)...
11. Consider the following set of n-6 observations of x and y given in Table 1...
 11. Consider the following set of n-6 observations of x and y given in Table 1 i. Graph the observations in a scatter plot on paper by hand by plotting x on the x-axis and y on the y-axis. Comment on the relationship. Using observations from Table 1, what are the sample means i and-? Using observations from Table 1, calculate the deviations and squared deviations from the sample mean for x: (x 11. iii. -x) and (x )for each...
B) Given the values in the table below, identify the population and sample regression lines on...
 B) Given the values in the table below, identify the population and sample regression lines on the graph. Denote the fitted value conditional expectation of y given X = X unobservable value and residdar for observation i with the appropriate letter on the graph (if you do not remember the notation, write the names at least!). (10 pts) Bo 1.1 0.4 Bo 0.7 LB 0.6 Kpopulation recension line • sample regression linen Luberesidual conditional expectation •fitted value
Procedure Use the following sets of data and work with each one. The equation for a...
 Procedure Use the following sets of data and work with each one. The equation for a linear graph is y mx+b, where m is the slope and b is the y-intercept. DATA SET 1: Fahrenheit-vs- Celsius Fahrenheit Celsius 32 68 104 140 176 0 20 40 60 80 1. Using Data Set 1 above, graph Fahrenheit (y) -vs- Celsius (x), using the scatterplot function in excel, or another graphing software. Make sure you label the axes. Fahrenheit should be on...
You may skip part (e) (x -R)2 0 4 (a) Complete the entries in the table....
 You may skip part (e)
(x -R)2 0 4 (a) Complete the entries in the table. Put the sums in the last row. What are the sample means x and y? (b) Calculate bi and b2 using (2.7) and (2.8) and state their interpretation. (c) Compute )vi. Using these numerical values, show that (d) Use the least squares estimates from part (b) to compute the fitted values of y, and plete the remainder of the table below. Put the sums...
You may skip part (e)
(x -R)2 0 4 (a) Complete the entries in the table. Put the sums in the last row. What are the sample means x and y? (b) Calculate bi and b2 using (2.7) and (2.8) and state their interpretation. (c) Compute )vi. Using these numerical values, show that (d) Use the least squares estimates from part (b) to compute the fitted values of y, and plete the remainder of the table below. Put the sums...
#2 between two quantities can be established. Procedure: Use the following sets of data and work...
 #2
between two quantities can be established. Procedure: Use the following sets of data and work with each one. The equation for a linear graph is y mx+b, where m is the slope and b is the y-intercept DATA SET 1: Fahrenheit-vs-Celsius Fahrenheit Celsius 32 68 104 140 176 0 20 40 60 80 1. Using Data Set 1 above, graph Fahrenheit (y)-vs- Celsius (x), using the scatterplot function in excel, or another graphing software. Make sure you label the...
#2
between two quantities can be established. Procedure: Use the following sets of data and work with each one. The equation for a linear graph is y mx+b, where m is the slope and b is the y-intercept DATA SET 1: Fahrenheit-vs-Celsius Fahrenheit Celsius 32 68 104 140 176 0 20 40 60 80 1. Using Data Set 1 above, graph Fahrenheit (y)-vs- Celsius (x), using the scatterplot function in excel, or another graphing software. Make sure you label the...
(x -R)2 0 4 (a) Complete the entries in the table. Put the sums in the...
 (x -R)2 0 4 (a) Complete the entries in the table. Put the sums in the last row. What are the sample means x and y? (b) Calculate bi and b2 using (2.7) and (2.8) and state their interpretation. (c) Compute )vi. Using these numerical values, show that (d) Use the least squares estimates from part (b) to compute the fitted values of y, and plete the remainder of the table below. Put the sums in the last row. yi...
You may skip parts (e) and (f)- I still need parts (g), (h), (i), and (j)....
 You may skip parts (e) and (f)- I still need parts (g), (h),
(i), and (j).
(x -R)2 0 4 (a) Complete the entries in the table. Put the sums in the last row. What are the sample means x and y? (b) Calculate bi and b2 using (2.7) and (2.8) and state their interpretation. (c) Compute )vi. Using these numerical values, show that (d) Use the least squares estimates from part (b) to compute the fitted values of y,...
You may skip parts (e) and (f)- I still need parts (g), (h),
(i), and (j).
(x -R)2 0 4 (a) Complete the entries in the table. Put the sums in the last row. What are the sample means x and y? (b) Calculate bi and b2 using (2.7) and (2.8) and state their interpretation. (c) Compute )vi. Using these numerical values, show that (d) Use the least squares estimates from part (b) to compute the fitted values of y,...
3. (40 points) Use the graph, an output of the least squares prediction equation for the starting salary data (in thous...
 3. (40 points) Use the graph, an output of the least squares prediction equation for the starting salary data (in thousands of dollars) given a graduated student's cumulative GPA, and the table of sampled data below to do the following Student ID GPA(x) 3.26 Starting Salary (y) 33.8 2.60 29.8 3.35 33.5 2.86 30.4 3.82 36.4 2.21 27.6 3.47 35.3 Regression Plot Y= 14.8156 + 5.70657x R-Sq 0.977 寸 853 4.0 2.0 2.5 3.0 3.5 GPA (a) Identify and interpret...
4.Consider the following five observations on Savings and Income for a given population. (25 poin...
 4.Consider the following five observations on Savings and Income for a given population. (25 points) Y i 0.0 0.9 0.4 12.4 6.4 7.0 7.0 0.3 a) Assuming that Y_i are observations (in thousands of dollars) on savings, and X_i observations on income (also in thousands of dollars), compute by hand and showing all the steps you need to calculate, the regression coefficients β0, and β1 in the regression b) Write an equation for the fitted regression line considering the regression...
We have the following hypothetical data for the independent variable x
 Simple Linear Regression (SLR) We have the following hypothetical data for the independent variable x (other names: regressor, covariate, or explanatory variable) and the dependent variable y (regressand). (a) Use Excel to draw a y-x scatter diagram with y on the vertical axis. Add the linear trend line. (b) Complete the table. Use 5 decimals throughout your calculations if applicable. (c) Give an equation for and manually calculate the slope b1. The table aids your calculations. (d) Give an equation for and calculate...
 11. Consider the following set of n-6 observations of x and y given in Table 1 i. Graph the observations in a scatter plot on paper by hand by plotting x on the x-axis and y on the y-axis. Comment on the relationship. Using observations from Table 1, what are the sample means i and-? Using observations from Table 1, calculate the deviations and squared deviations from the sample mean for x: (x 11. iii. -x) and (x )for each...
 B) Given the values in the table below, identify the population and sample regression lines on the graph. Denote the fitted value conditional expectation of y given X = X unobservable value and residdar for observation i with the appropriate letter on the graph (if you do not remember the notation, write the names at least!). (10 pts) Bo 1.1 0.4 Bo 0.7 LB 0.6 Kpopulation recension line • sample regression linen Luberesidual conditional expectation •fitted value
 Procedure Use the following sets of data and work with each one. The equation for a linear graph is y mx+b, where m is the slope and b is the y-intercept. DATA SET 1: Fahrenheit-vs- Celsius Fahrenheit Celsius 32 68 104 140 176 0 20 40 60 80 1. Using Data Set 1 above, graph Fahrenheit (y) -vs- Celsius (x), using the scatterplot function in excel, or another graphing software. Make sure you label the axes. Fahrenheit should be on...
 You may skip part (e)
(x -R)2 0 4 (a) Complete the entries in the table. Put the sums in the last row. What are the sample means x and y? (b) Calculate bi and b2 using (2.7) and (2.8) and state their interpretation. (c) Compute )vi. Using these numerical values, show that (d) Use the least squares estimates from part (b) to compute the fitted values of y, and plete the remainder of the table below. Put the sums...
You may skip part (e)
(x -R)2 0 4 (a) Complete the entries in the table. Put the sums in the last row. What are the sample means x and y? (b) Calculate bi and b2 using (2.7) and (2.8) and state their interpretation. (c) Compute )vi. Using these numerical values, show that (d) Use the least squares estimates from part (b) to compute the fitted values of y, and plete the remainder of the table below. Put the sums...
 #2
between two quantities can be established. Procedure: Use the following sets of data and work with each one. The equation for a linear graph is y mx+b, where m is the slope and b is the y-intercept DATA SET 1: Fahrenheit-vs-Celsius Fahrenheit Celsius 32 68 104 140 176 0 20 40 60 80 1. Using Data Set 1 above, graph Fahrenheit (y)-vs- Celsius (x), using the scatterplot function in excel, or another graphing software. Make sure you label the...
#2
between two quantities can be established. Procedure: Use the following sets of data and work with each one. The equation for a linear graph is y mx+b, where m is the slope and b is the y-intercept DATA SET 1: Fahrenheit-vs-Celsius Fahrenheit Celsius 32 68 104 140 176 0 20 40 60 80 1. Using Data Set 1 above, graph Fahrenheit (y)-vs- Celsius (x), using the scatterplot function in excel, or another graphing software. Make sure you label the...
 (x -R)2 0 4 (a) Complete the entries in the table. Put the sums in the last row. What are the sample means x and y? (b) Calculate bi and b2 using (2.7) and (2.8) and state their interpretation. (c) Compute )vi. Using these numerical values, show that (d) Use the least squares estimates from part (b) to compute the fitted values of y, and plete the remainder of the table below. Put the sums in the last row. yi...
 You may skip parts (e) and (f)- I still need parts (g), (h),
(i), and (j).
(x -R)2 0 4 (a) Complete the entries in the table. Put the sums in the last row. What are the sample means x and y? (b) Calculate bi and b2 using (2.7) and (2.8) and state their interpretation. (c) Compute )vi. Using these numerical values, show that (d) Use the least squares estimates from part (b) to compute the fitted values of y,...
You may skip parts (e) and (f)- I still need parts (g), (h),
(i), and (j).
(x -R)2 0 4 (a) Complete the entries in the table. Put the sums in the last row. What are the sample means x and y? (b) Calculate bi and b2 using (2.7) and (2.8) and state their interpretation. (c) Compute )vi. Using these numerical values, show that (d) Use the least squares estimates from part (b) to compute the fitted values of y,...
 3. (40 points) Use the graph, an output of the least squares prediction equation for the starting salary data (in thousands of dollars) given a graduated student's cumulative GPA, and the table of sampled data below to do the following Student ID GPA(x) 3.26 Starting Salary (y) 33.8 2.60 29.8 3.35 33.5 2.86 30.4 3.82 36.4 2.21 27.6 3.47 35.3 Regression Plot Y= 14.8156 + 5.70657x R-Sq 0.977 寸 853 4.0 2.0 2.5 3.0 3.5 GPA (a) Identify and interpret...
 4.Consider the following five observations on Savings and Income for a given population. (25 points) Y i 0.0 0.9 0.4 12.4 6.4 7.0 7.0 0.3 a) Assuming that Y_i are observations (in thousands of dollars) on savings, and X_i observations on income (also in thousands of dollars), compute by hand and showing all the steps you need to calculate, the regression coefficients β0, and β1 in the regression b) Write an equation for the fitted regression line considering the regression...
Most questions answered within 3 hours.
-
A mixture of 0.500 mols of NO and 0.100 mols O2 are combined in
a 5...
asked 15 seconds from now -
A certain weak base has a Kb of 8.80×10⁻⁷. What concentration of
this base will produce...
asked 38 seconds ago -
Given the following list of objects and a fixed bin size of
70:
L = [16,...
asked 3 minutes ago -
Suppose that the average U.S. household uses 12100 kWh
(kilowatt‑hours) of energy in a year. If...
asked 8 minutes ago -
Patterson Company operates three segments. Income statements for
the segments imply that profitability could be improved...
asked 7 minutes ago -
In 20 words or less, what aspect of your degree course are you
passionate about? civil...
asked 19 minutes ago -
Learning Goal: To understand the relation between the strength
of an acid or a base and...
asked 20 minutes ago -
Discuss the role of integrated marketing communications
(IMC) in a firm’s overall marketing strategy? When executed...
asked 20 minutes ago -
(in Java) We wish to insert the following strings into a hash
table: BEN AL SUE...
asked 29 minutes ago -
Group think happens when the members of the group become more
interested in agreeing with each...
asked 28 minutes ago -
how might the HR Scorecard might be used to demonstrate value
creation that aligns with the...
asked 45 minutes ago -
If the racetrack publishes that the odds in favor of a horse
winning a race are...
asked 53 minutes ago