
Homework Answers
Add Answer to:
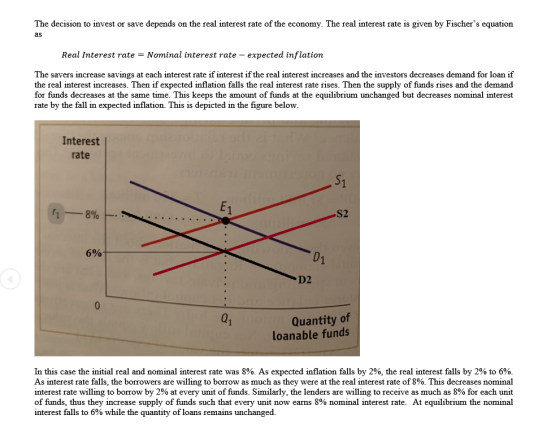
10. Using the accompanying diagram, explain what will happen to the market for loanable funds when...
7. Understanding the Fisher effect Aa Aa The following graphs show the loanable funds market. The...
 7. Understanding the Fisher effect Aa Aa The following graphs show the loanable funds market. The upward-sloping orange line represents the supply of loanable funds, and the downward-sloping blue line represents the demand for loanable funds. For each of the following scenarios, use the graph to show how the market will react to the given change in the expected future inflation rate. The following graph shows the demand and supply curves for loanable funds when the expected future inflation rate...
Suppose firms fear a recession and expected profits decrease, what will happen in the loanable funds...
Suppose firms fear a recession and expected profits decrease, what will happen in the loanable funds market a. interest rate increases, quantity of loanable funds increases b. interest rate decreases, quantity of loanable funds increases c. interest rate increases, quantity of loanable funds decreases d. interest rate decreases, quantity of loanable funds decreases
Interest Rate SAQ, QO Quantity of Loanable Funds Refer to the market for loanable funds, as...
 Interest Rate SAQ, QO Quantity of Loanable Funds Refer to the market for loanable funds, as shown in the above graph. Suppose the market for loanable funds is originally in equilibrium at interest rate lo and quantity 20. In the next period, the equilibrium interest rate increases to ly and quantity decreases to Q1. Which of the following could be the cause of this shift? Investors become more optimistic Households decide to save more Households decide to save less Investors...
Let assume an economy in this year with the following loanable funds (LF) market demand equation....
 Let assume an economy in this year with the following loanable funds (LF) market demand equation. Demand: r = 8 – 0.005 * Qp Where, r is the real interest rate (ifr=12 then the interest rate is 12%), Q, in the quantity demanded of loanable funds (total investment). The government expenditures (G) is $300 billion, collected taxes (T) equal to $700 billion, and private saving is $800 billion. 1. Calculate the value of government savings in this economy. Is the...
4. Supply and demand for loanable funds The following graph shows the market for loanable funds in a closed economy.
 4. Supply and demand for loanable funds The following graph shows the market for loanable funds in a closed economy. The upward-sloping orange line represents the supply of loanable funds, and the downward-sloping blue line represents the demand for loan funds _______ is the source of the demand for loanable funds. As the interest rate falls, the quantity of loanable funds demanded _______ Suppose the interest rate is 4.5%. Based on the previous graph, the quantity of loanable funds supplied is _______ than...
In a different scenario, suppose that the demand and supply curves for loanable funds shown on...
 In a different scenario, suppose that the demand and supply curves for loanable funds shown on the following graph occur when the expected future inflation rate is 5%. Then, a sudden shock to the economy causes the expected future inflation rate to rise to 9.6%. Assuming the Fisher effect holds, show the impact that this will have on the loanable funds market by shifting one or both curves on the following graph Tool tip: Click and drag one or both...
Interest rate $100 Quantity of loanable funds (billions of dollars) In the Loanable Funds diagram (shown),...
 Interest rate $100 Quantity of loanable funds (billions of dollars) In the Loanable Funds diagram (shown), a decrease in savings by the private sector will shift the curve to the , causing the equilibrium interest rate to
How does the loanable funds market translate savings into investment and what adjusts to bring the...
 How does the loanable funds market translate savings into investment and what adjusts to bring the market to equilibrium? A. The savings provide the supply of loanable funds, while investment is the demand for loanable funds. While financial markets provide a means of transferring savings into investment, it is the inflation rate that changes to bring the market into equilibrium. B. The investments provide the supply of loanable funds, while saving is the demand for loanable funds. While financial markets...
The following graph shows the market for loanable funds in a closed economy.
 The following graph shows the market for loanable funds in a closed economy. The upward-sloping orange line represents the supply of loanable funds, and the downward-sloping blue line represents the demand for loanable funds. Saving is the source of the supply of loanable funds. As the real interest rate rises, the quantity of loanable funds demanded decreases Suppose the real interest rate is 7%. In this case, the quantity of loanable funds supplied is greater than the quantity of loans...
The loanable funds market is in equilibrium. Due to a change in tax law, many workers...
The loanable funds market is in equilibrium. Due to a change in tax law, many workers increase the amount of their income that they devote to retirement savings (and consume less). What happens? The demand for loanable funds shifts to the right, and interest rates rise. The supply of loanable funds shifts to the right, and interest rates fall. The demand for loanable funds shifts to the left, and interest rates fall. The supply of loanable funds shifts left, and...
 7. Understanding the Fisher effect Aa Aa The following graphs show the loanable funds market. The upward-sloping orange line represents the supply of loanable funds, and the downward-sloping blue line represents the demand for loanable funds. For each of the following scenarios, use the graph to show how the market will react to the given change in the expected future inflation rate. The following graph shows the demand and supply curves for loanable funds when the expected future inflation rate...
 Interest Rate SAQ, QO Quantity of Loanable Funds Refer to the market for loanable funds, as shown in the above graph. Suppose the market for loanable funds is originally in equilibrium at interest rate lo and quantity 20. In the next period, the equilibrium interest rate increases to ly and quantity decreases to Q1. Which of the following could be the cause of this shift? Investors become more optimistic Households decide to save more Households decide to save less Investors...
 Let assume an economy in this year with the following loanable funds (LF) market demand equation. Demand: r = 8 – 0.005 * Qp Where, r is the real interest rate (ifr=12 then the interest rate is 12%), Q, in the quantity demanded of loanable funds (total investment). The government expenditures (G) is $300 billion, collected taxes (T) equal to $700 billion, and private saving is $800 billion. 1. Calculate the value of government savings in this economy. Is the...
 In a different scenario, suppose that the demand and supply curves for loanable funds shown on the following graph occur when the expected future inflation rate is 5%. Then, a sudden shock to the economy causes the expected future inflation rate to rise to 9.6%. Assuming the Fisher effect holds, show the impact that this will have on the loanable funds market by shifting one or both curves on the following graph Tool tip: Click and drag one or both...
 Interest rate $100 Quantity of loanable funds (billions of dollars) In the Loanable Funds diagram (shown), a decrease in savings by the private sector will shift the curve to the , causing the equilibrium interest rate to
 How does the loanable funds market translate savings into investment and what adjusts to bring the market to equilibrium? A. The savings provide the supply of loanable funds, while investment is the demand for loanable funds. While financial markets provide a means of transferring savings into investment, it is the inflation rate that changes to bring the market into equilibrium. B. The investments provide the supply of loanable funds, while saving is the demand for loanable funds. While financial markets...
Most questions answered within 3 hours.
-
Given that many conflict are the result of different parties having
different interests, is it possible...
asked 1 minute from now -
A 750 g block can slide uniformly along the horizontal track
when a string attached to...
asked 1 minute ago -
In 2017, Juan entered into a contract to write a book. The
publisher advanced Juan $50,000,...
asked 14 minutes ago -
Determine the number of kinds of protons in each molecule (w/
respect to NMR spectroscopy). Drawing...
asked 25 minutes ago -
A jeweler whose near point is 68 cm from his eye uses a
magnifying glass as...
asked 23 minutes ago -
A company wants to determine how many units of each of two
products, A and B,...
asked 27 minutes ago -
The blood pressure of a person changes throughout the day.
Suppose the systolic blood pressure of...
asked 36 minutes ago -
A chemistry student desired to study sulfur. Sulfur exhibited
the following characteristics with oxygen:
(a) It...
asked 31 minutes ago -
An Atwood machine is constructed of a solid-disk frictionless
pulley of mass m3 and radius R....
asked 33 minutes ago -
what are the advantages of lanthanum hexaboride over tungsten
filament for electron emission
what is the...
asked 35 minutes ago -
Question 5
Your uncle offers to sell you his vintage Rolls Royce. He
suggests a payment...
asked 40 minutes ago -
Quality grading of beef products as Prime, Choice, Select. What
type of data?
A) ratio
B)...
asked 49 minutes ago