
Homework Answers
Please refer to below spreadsheet for calculation and answer. Cell reference also provided.
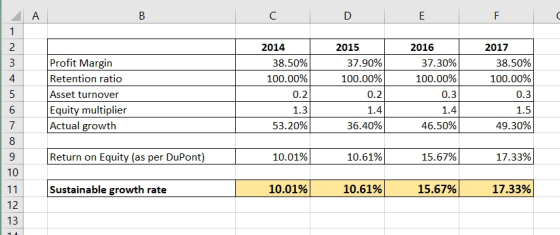
Cell reference -

ROE = Profit Margin*Asset Turnover*Equity Multiplier
Sustainable growth rate = ROE*Retention ratio
b.
Sustainable growth rate is a maximum growth rate that company can achieve without issuing additional equity and changing current capital structure.
In above case, Actual growth rate is higher than Spartan's sustainable growth rate thus spartan must issue additional equity or debt to support this rapid growth.
Add Answer to:
Spartan, Inc., has the following ratios for the years 2014-2017: 2014 2015 2016 2017 Profit margin...
inventory turnover ratios as follows: 2014- 1.96 times 2015- 1.74 times 2016- 1.65 times 2017 -...
inventory turnover ratios as follows: 2014- 1.96 times 2015- 1.74 times 2016- 1.65 times 2017 - 2.44 times 2018- 2.96 times what is this saying about the company?
Year 2014 2015 2016 2017 2018 Dividend $0.8 $0.9 $1.00 $1.3 $1.4 $ Change ? ?...
Year 2014 2015 2016 2017 2018 Dividend $0.8 $0.9 $1.00 $1.3 $1.4 $ Change ? ? ? ? % Change ? ? ? ? Given the dividend information above, if the dividend just paid is $1.4 in 2018 and the price per share of this company’s stock is $64, what is the cost of equity using the dividend growth model?
Q1. (10 Points) 2014 Year 2015 2017 2018 2016 $0.8 $0.9 $1.00 $1.3 $1.4 Dividend $...
 Q1. (10 Points) 2014 Year 2015 2017 2018 2016 $0.8 $0.9 $1.00 $1.3 $1.4 Dividend $ Change % Change Given the dividend information above, if the dividend just paid is $1.4 in 2018 and the price per share of this company's stock is $64, what is the cost of equity using the dividend growth model? Q2. (10 Points) What is ABC Inc's beta if its expected return is 10.7%, the market risk premium is 6.5%, and the riskless rate is...
I need help getting the quick ratio and net profit margin for the years 2017 and...
 I need help getting the quick ratio and net profit margin for
the years 2017 and 2016 thanks, let me know if you need more info
please
3. Consolidated balance sheet Assets Dec 31, 2018 Dec 31, 2017 Dec 31, 2016 16576 16.07 16.00 Gwa 12.192 20111045 1440 15217 123 Property plant and equipment Iements in Sint ventures and associates Non creavilable for le financuas 1.100 Other curatat ONS D. 1.9.2 1.741 2.131 4144 Non-current as Inventaries and work in...
I need help getting the quick ratio and net profit margin for
the years 2017 and 2016 thanks, let me know if you need more info
please
3. Consolidated balance sheet Assets Dec 31, 2018 Dec 31, 2017 Dec 31, 2016 16576 16.07 16.00 Gwa 12.192 20111045 1440 15217 123 Property plant and equipment Iements in Sint ventures and associates Non creavilable for le financuas 1.100 Other curatat ONS D. 1.9.2 1.741 2.131 4144 Non-current as Inventaries and work in...
Need formula for ratios. Dec. 31, 2017 Dec 31, 2016 $ 687,521 $ 759,984 5,519 329,986...
 Need formula for ratios.
Dec. 31, 2017 Dec 31, 2016 $ 687,521 $ 759,984 5,519 329,986 2,105,662 538,202 47,518 175,853 3,884,742 4,859,424 967,781 19,816 55,947 109,073 75,889 9,972,672 285,106 2,076,261 499,917 52,574 174,491 3,853,852 4,759,197 981,593 53,391 167,729 74,478 9,890,240 Consolidated Balance Sheets - USD ($) $ in Thousands 2 Current assets: 3 Cash and cash equivalents 4 Marketable securities 5 Accounts receivable, net 6 Finance receivables, net 7 Inventories 8 Restricted cash 9 other current assets 10 Total current...
Need formula for ratios.
Dec. 31, 2017 Dec 31, 2016 $ 687,521 $ 759,984 5,519 329,986 2,105,662 538,202 47,518 175,853 3,884,742 4,859,424 967,781 19,816 55,947 109,073 75,889 9,972,672 285,106 2,076,261 499,917 52,574 174,491 3,853,852 4,759,197 981,593 53,391 167,729 74,478 9,890,240 Consolidated Balance Sheets - USD ($) $ in Thousands 2 Current assets: 3 Cash and cash equivalents 4 Marketable securities 5 Accounts receivable, net 6 Finance receivables, net 7 Inventories 8 Restricted cash 9 other current assets 10 Total current...
 Q1. (10 Points) 2014 Year 2015 2017 2018 2016 $0.8 $0.9 $1.00 $1.3 $1.4 Dividend $ Change % Change Given the dividend information above, if the dividend just paid is $1.4 in 2018 and the price per share of this company's stock is $64, what is the cost of equity using the dividend growth model? Q2. (10 Points) What is ABC Inc's beta if its expected return is 10.7%, the market risk premium is 6.5%, and the riskless rate is...
 I need help getting the quick ratio and net profit margin for
the years 2017 and 2016 thanks, let me know if you need more info
please
3. Consolidated balance sheet Assets Dec 31, 2018 Dec 31, 2017 Dec 31, 2016 16576 16.07 16.00 Gwa 12.192 20111045 1440 15217 123 Property plant and equipment Iements in Sint ventures and associates Non creavilable for le financuas 1.100 Other curatat ONS D. 1.9.2 1.741 2.131 4144 Non-current as Inventaries and work in...
I need help getting the quick ratio and net profit margin for
the years 2017 and 2016 thanks, let me know if you need more info
please
3. Consolidated balance sheet Assets Dec 31, 2018 Dec 31, 2017 Dec 31, 2016 16576 16.07 16.00 Gwa 12.192 20111045 1440 15217 123 Property plant and equipment Iements in Sint ventures and associates Non creavilable for le financuas 1.100 Other curatat ONS D. 1.9.2 1.741 2.131 4144 Non-current as Inventaries and work in...
 Need formula for ratios.
Dec. 31, 2017 Dec 31, 2016 $ 687,521 $ 759,984 5,519 329,986 2,105,662 538,202 47,518 175,853 3,884,742 4,859,424 967,781 19,816 55,947 109,073 75,889 9,972,672 285,106 2,076,261 499,917 52,574 174,491 3,853,852 4,759,197 981,593 53,391 167,729 74,478 9,890,240 Consolidated Balance Sheets - USD ($) $ in Thousands 2 Current assets: 3 Cash and cash equivalents 4 Marketable securities 5 Accounts receivable, net 6 Finance receivables, net 7 Inventories 8 Restricted cash 9 other current assets 10 Total current...
Need formula for ratios.
Dec. 31, 2017 Dec 31, 2016 $ 687,521 $ 759,984 5,519 329,986 2,105,662 538,202 47,518 175,853 3,884,742 4,859,424 967,781 19,816 55,947 109,073 75,889 9,972,672 285,106 2,076,261 499,917 52,574 174,491 3,853,852 4,759,197 981,593 53,391 167,729 74,478 9,890,240 Consolidated Balance Sheets - USD ($) $ in Thousands 2 Current assets: 3 Cash and cash equivalents 4 Marketable securities 5 Accounts receivable, net 6 Finance receivables, net 7 Inventories 8 Restricted cash 9 other current assets 10 Total current...
Most questions answered within 3 hours.
-
MCL 445.111 et seq. deals with Home Solicitation Sales.
MCL stands for Michigan Compiled Laws which...
asked 7 minutes ago -
Which of the following items may not create an NOL?
a.
sole proprietorship loss
b.
personal...
asked 12 minutes ago -
A hypothetical solution forms between a solid and a liquid. The
values of the thermodynamic quantities...
asked 11 minutes ago -
when 2053 j of heat is added to 46.3 g of hexane C6H14 the
temperature increases...
asked 14 minutes ago -
a)An ideal heat pump is being considered for use in heating an
environment with a temperature...
asked 14 minutes ago -
.
Convert the following pairs of voltage and current waveforms to
phasor form. Each pair of...
asked 15 minutes ago -
I need new and unique answers, please. (Use your own words,
don't copy and paste), Please...
asked 17 minutes ago -
A 6.5 cm diameter ball has a terminal speed of 22 m/s. What is
the ball's...
asked 29 minutes ago -
Name two areas of the human body with the highest concentration
of lymph nodes and speculate...
asked 33 minutes ago -
Angel Corporation has $10,000,000 of
8.0% 25 year bonds dated May 1, 2018 with interest payable...
asked 1 hour ago -
7.
________ involves individuals trading goods they already have or
providing services in exchange for something...
asked 1 hour ago -
Share your research problem. What databases did you search as
you gathered evidence to support your...
asked 1 hour ago