
Homework Answers
Add Answer to:
Statistics Question Help Please
Exercise 2: In a study, scientists examine data on the "Sea temperature"...
Please help with this statistics problem. Exercise 2: In a study, scientists examine data on the...
 Please
help with this statistics problem.
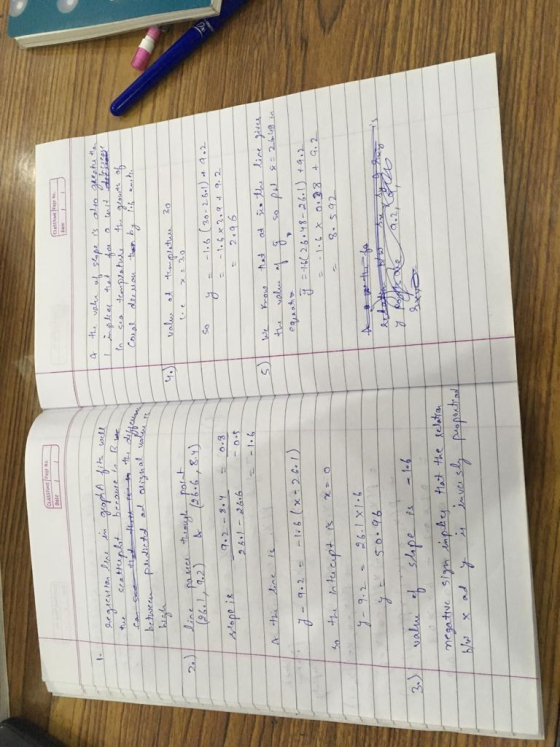
Exercise 2: In a study, scientists examine data on the "Sea temperature" (variable r, in celsius) and "Coral growth" (response y, in millimetres) over a several-years period in the Gulf of Mexico and the Caribbeans. The scatterplot in graph A displays the relationship between and y 262 26.7 263 264 26.5 26.0 Sea Tamperature Answer the following questions providing all the mathematical details. 1. Which regression line (in graphs A and B) fits well...
Please
help with this statistics problem.
Exercise 2: In a study, scientists examine data on the "Sea temperature" (variable r, in celsius) and "Coral growth" (response y, in millimetres) over a several-years period in the Gulf of Mexico and the Caribbeans. The scatterplot in graph A displays the relationship between and y 262 26.7 263 264 26.5 26.0 Sea Tamperature Answer the following questions providing all the mathematical details. 1. Which regression line (in graphs A and B) fits well...
can somebody please help me with the question quickly I really need help with this, choose a country and research population data in order to fill out the table below.
 2. Choose a country and research population data in order to fill out the table beloa. Copy the population numbers counted each five years, as shown in the data base, for the years from 1950 to 2000 . Add a column, \(t\), measuring years șince 1945 .b. What is the country you selected? In what part of the world is it? What is the magnitude of its population numbers? \(\left(100,000^{\circ} \mathrm{s}\right.\), millions, hundred millions, billions?) Is it growing or shrinking...
 Please
help with this statistics problem.
Exercise 2: In a study, scientists examine data on the "Sea temperature" (variable r, in celsius) and "Coral growth" (response y, in millimetres) over a several-years period in the Gulf of Mexico and the Caribbeans. The scatterplot in graph A displays the relationship between and y 262 26.7 263 264 26.5 26.0 Sea Tamperature Answer the following questions providing all the mathematical details. 1. Which regression line (in graphs A and B) fits well...
Please
help with this statistics problem.
Exercise 2: In a study, scientists examine data on the "Sea temperature" (variable r, in celsius) and "Coral growth" (response y, in millimetres) over a several-years period in the Gulf of Mexico and the Caribbeans. The scatterplot in graph A displays the relationship between and y 262 26.7 263 264 26.5 26.0 Sea Tamperature Answer the following questions providing all the mathematical details. 1. Which regression line (in graphs A and B) fits well...
Most questions answered within 3 hours.
-
A gas tank is a vertical cylinder. It has a radius of 1m, a
height of...
asked 5 seconds ago -
Accent Software faces the following conditions. All of these
support Accent’s use of a market-penetration pricing...
asked 56 minutes ago -
A mathematically inclined friend emails you the following
instructions: "Meet me in the cafeteria the first...
asked 59 minutes ago -
A monopoly sells in two countries . The demand curves in the two
countries are p1...
asked 1 hour ago -
A .15kg rubber ball is bounced off a wall. Before hitting the
wall, the ball moves...
asked 2 hours ago -
A manufacturing company preparing to build a new plant is
considering three potential locations for it....
asked 2 hours ago -
B. If compound Y has approximately the same values of solubility
in toluene as compound X,...
asked 3 hours ago -
Oscar Inc. has inventory in Japan valued at 39,051,000 Yen one
year ago. One year ago...
asked 3 hours ago -
If Canada suffered from "fundamental disequilibrium," and its
government choose not to devalue its currency, a...
asked 3 hours ago -
4. How many input & output Key Value Pairs are passed into,
and emitted out of...
asked 3 hours ago -
Why would your heart not function well if constructed of
skeletal muscle? What is the particular...
asked 3 hours ago -
Please respond to this essay question in full essay form for
Chemistry 1102 Organic and Biochemistry:...
asked 3 hours ago