can somebody please help me with the question quickly I really need help with this, choose a country and research population data in order to fill out the table below.


2. Choose a country and research population data in order to fill out the table belo
a. Copy the population numbers counted each five years, as shown in the data base, for the years from 1950 to 2000 . Add a column, \(t\), measuring years șince 1945 .
b. What is the country you selected? In what part of the world is it? What is the magnitude of its population numbers? \(\left(100,000^{\circ} \mathrm{s}\right.\), millions, hundred millions, billions?) Is it growing or shrinking in population size?
c. Enter years since 1945 and your population numbers into your graphing calculator. Create a scatterplot of the data. Is the data growing or shrinking? Does it appear to be a linear pattern or non-linear? Explain your conclusions.
d. Use your calculator to fit a linear model to the population size.
i. Write the equation of the linear regression and superimpose its graph on your scatterplot.
ii. Use TI-Connect to copy the scatterplot onto your write-up, or just draw a sketch of it.
iii. How well does the linear model fit your data?
iv. What is the vertical intercept of the regression model? What does it mean in the context of the population?
v. What is the slope of the regression model? What does it mean in the context of the population?
vi. Use the model to predict the population size in the year you were born. Also, use the model to predict the population size in the year \(2007 .\)
e. Next fit an exponential model to your population data.
i. Write the equation of the exponential regression and superimpose its graph on your scatterplot.
ii. How well does the exponential model fit your data? By looking at the graphs, does it appear that the exponential model fits better than the linear model?
iii. What is the exponential factor in your model? What does it mean in the context of the population?
f. Experiment with some of the other regression models we have covered in class, and pick one of them to explain your population data. Write a paragraph explaining which regression model you feel best explains the population changes in your country.
Homework Answers
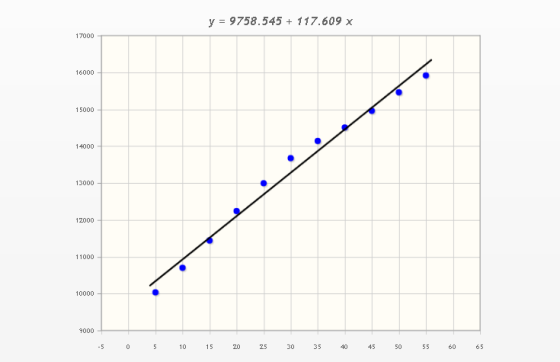

equation of the regression line is y=9758.545+117.609x
slope = 117.609
I was born in the Year 1993 so x=48
Y=9758.545+117.609*48=15403.777
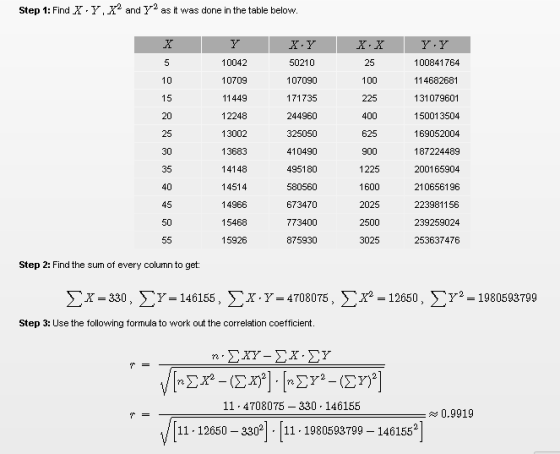
the line fits well as the correlation coefficient is 0.9919 near to 1
Add Answer to:
can somebody please help me with the question quickly I really need help with this, choose a country and research population data in order to fill out the table below.
can i get some help on this question please, thanks! The values below shows the number...
 can
i get some help on this question please, thanks!
The values below shows the number of new stores in a coffee shop chain that opened during the years 1986 through 1994. 1986, 14 1987, 27 1988, 48 1989, 80 1990, 110 1991, 153 1992, 261 1993, 403 1994, 681 Use your TI to create two lists L1 for year, L2 for number of new stores. Then create a third list L3 which takes Ln(L2) -- the natural log of...
can
i get some help on this question please, thanks!
The values below shows the number of new stores in a coffee shop chain that opened during the years 1986 through 1994. 1986, 14 1987, 27 1988, 48 1989, 80 1990, 110 1991, 153 1992, 261 1993, 403 1994, 681 Use your TI to create two lists L1 for year, L2 for number of new stores. Then create a third list L3 which takes Ln(L2) -- the natural log of...
For expert using R , I solve it but i need to figure out what I...
 For expert using R , I solve it but i need to figure out what
I got is correct or wrong. Thank you
# Simple Linear Regression and Polynomial Regression
# HW 2
#
# Read data from csv file
data <-
read.csv("C:\data\SweetPotatoFirmness.csv",header=TRUE,
sep=",")
head(data)
str(data)
# scatterplot of independent and dependent variables
plot(data$pectin,data$firmness,xlab="Pectin,
%",ylab="Firmness")
par(mfrow = c(2, 2)) # Split the plotting panel into a 2 x 2
grid
model <- lm(firmness ~ pectin , data=data)
summary(model)
anova(model)
plot(model)...
For expert using R , I solve it but i need to figure out what
I got is correct or wrong. Thank you
# Simple Linear Regression and Polynomial Regression
# HW 2
#
# Read data from csv file
data <-
read.csv("C:\data\SweetPotatoFirmness.csv",header=TRUE,
sep=",")
head(data)
str(data)
# scatterplot of independent and dependent variables
plot(data$pectin,data$firmness,xlab="Pectin,
%",ylab="Firmness")
par(mfrow = c(2, 2)) # Split the plotting panel into a 2 x 2
grid
model <- lm(firmness ~ pectin , data=data)
summary(model)
anova(model)
plot(model)...
Styles The data in the accompanying table represent the population of a certain country every 10 ...
 Styles The data in the accompanying table represent the population of a certain country every 10 years for the years 1900-2000. An ecologist is interested in finding an equation that describes the population of the country over time. Complete parts (a) through (3) below Year, x 1900 1910 1920 1930 1940 1950 Population, y Year, x Population, y 179,323 203,302 79,212 1960 95,228 1970 104,021 1980 123,202 1990 132,164 2000 151,325 226,542 248,709 281,421 (a)Determine the least-squares regression equation, treating...
Statistics Question Help Please Exercise 2: In a study, scientists examine data on the "Sea temperature"...
 Statistics Question Help Please
Exercise 2: In a study, scientists examine data on the "Sea temperature" (variable r, in celsius) and "Coral growth" (response y, in millimetres) over a several-years period in the Gulf of Mexico and the Caribbeans. The scatterplot in graph A displays the relationship between and y 262 26.7 263 264 26.5 26.0 Sea Tamperature Answer the following questions providing all the mathematical details. 1. Which regression line (in graphs A and B) fits well the scatterplot?...
Statistics Question Help Please
Exercise 2: In a study, scientists examine data on the "Sea temperature" (variable r, in celsius) and "Coral growth" (response y, in millimetres) over a several-years period in the Gulf of Mexico and the Caribbeans. The scatterplot in graph A displays the relationship between and y 262 26.7 263 264 26.5 26.0 Sea Tamperature Answer the following questions providing all the mathematical details. 1. Which regression line (in graphs A and B) fits well the scatterplot?...
0.2 pts) Based upon the data what can you say about the mean size of leaves...
 0.2 pts) Based upon the data what can you say about the mean size of leaves you would expect on trees that are 20 meters away from the road? (explain your reasoning) (k, 2 pts) Based upon the data what can you say about the mean size of leaves you would expect on trees that are 30 meters away from the road? (explain your reasoning) (1.2 pts) Based upon your results above can we conclude that pollution from the road...
I need help from 9-11. I calculated 7-8 below. 7)Alcohol Consumption (liters/person/year): 3 Heart disease = 260.56-22.969(3) = 191.653 8) Alcohol Consumption (liters/pers...
 I need help from 9-11.
I calculated 7-8 below.
7)Alcohol Consumption (liters/person/year): 3
Heart disease =
260.56-22.969(3)
= 191.653
8) Alcohol Consumption (liters/person/year): 15
Heart disease =
260.56-22.969(15)
= -83.975
It wouldn’t be appropriate because the heart disease is
in -83.975.
The following table presents data on wine consumption (in liters per person per year) and death rate from heart attacks (in deaths per 100,000 people per year) in 19 developed Western countries. WINE CONSUMPTION AND HEART ATTACKS Alcohol Heart...
I need help from 9-11.
I calculated 7-8 below.
7)Alcohol Consumption (liters/person/year): 3
Heart disease =
260.56-22.969(3)
= 191.653
8) Alcohol Consumption (liters/person/year): 15
Heart disease =
260.56-22.969(15)
= -83.975
It wouldn’t be appropriate because the heart disease is
in -83.975.
The following table presents data on wine consumption (in liters per person per year) and death rate from heart attacks (in deaths per 100,000 people per year) in 19 developed Western countries. WINE CONSUMPTION AND HEART ATTACKS Alcohol Heart...
I wonder only both (d) and (e). If you use excel, please show what you do exactly. Please help me. Thanks. ts) Can-Do Canoe sells lightweight portable canoes. Quarterly demand for its most 2. (70...
 I wonder only both (d) and (e).
If you use excel, please show what you do exactly.
Please help me. Thanks.
ts) Can-Do Canoe sells lightweight portable canoes. Quarterly demand for its most 2. (70 point ar product family over the past 3 years has been as follows. popul 2015 2 2016 2 2017 Year Demand 25 120 40 60 30 140 608035 150 55 90 4 Quarter a) (10 points) Use an exponential smoothing model with smoothing constant a...
I wonder only both (d) and (e).
If you use excel, please show what you do exactly.
Please help me. Thanks.
ts) Can-Do Canoe sells lightweight portable canoes. Quarterly demand for its most 2. (70 point ar product family over the past 3 years has been as follows. popul 2015 2 2016 2 2017 Year Demand 25 120 40 60 30 140 608035 150 55 90 4 Quarter a) (10 points) Use an exponential smoothing model with smoothing constant a...
I answered the First one that was making this table. I'm stuck after. 1 Year Population...
I answered the First one that was making this table. I'm stuck after. 1 Year Population 2000 6 x 10⁹ 2050 12 x 109 = 1.2 x 10¹⁰ 2100 24 x 109 = 2.4 x 10¹⁰ 2150 48 x 109 =4.8 x 10¹⁰ 2200 96 x 109 = 9.6 x10¹⁰ 2250 192 x 109 = 1.92 x 10¹¹ 2300 384 x 109 = 3.84 x 10¹¹ 2350 768 x 109 = 7.68 x 10¹¹ 2400 1536 x 109 = 1.536...
I only need help for the last question "What Went Wrong?". Thank you! After seeing the...
 I only need help for the last question
"What Went Wrong?". Thank you!
After seeing the problem, your classmate Alice immediately argues that we can apply a linear regression model, as the labels are numbers from 0-9, very similar to the example we learned from Unit 1. Though being a little doubtful, you decide to have a try and start simple by using the raw pixel values of each image as features. Alice wrote a skeleton code run_linear_regression_on_MNIST in main.py,...
I only need help for the last question
"What Went Wrong?". Thank you!
After seeing the problem, your classmate Alice immediately argues that we can apply a linear regression model, as the labels are numbers from 0-9, very similar to the example we learned from Unit 1. Though being a little doubtful, you decide to have a try and start simple by using the raw pixel values of each image as features. Alice wrote a skeleton code run_linear_regression_on_MNIST in main.py,...
Please I want someone help me to solve this question a,b,c,d,e I’m not sure about my...
 Please I want someone help me to solve this question
a,b,c,d,e
I’m not sure about my solution
This is the data
# Set directory to data folder
setwd("C:data")
# getwd()
# Read data from csv file
data <- read.csv("SweetPotatoFirmness.csv",header=TRUE,
sep=",")
head(data)
str(data)
# scatterplot of independent and dependent variables
plot(data$pectin,data$firmness,xlab="Pectin,
%",ylab="Firmness")
par(mfrow = c(2, 2)) # Split the plotting panel into a 2 x 2
grid
model <- lm(firmness ~ pectin , data=data)
summary(model)
plot(model)
par(mfrow=c(1,1))
# Residual Plot
data$residuals...
Please I want someone help me to solve this question
a,b,c,d,e
I’m not sure about my solution
This is the data
# Set directory to data folder
setwd("C:data")
# getwd()
# Read data from csv file
data <- read.csv("SweetPotatoFirmness.csv",header=TRUE,
sep=",")
head(data)
str(data)
# scatterplot of independent and dependent variables
plot(data$pectin,data$firmness,xlab="Pectin,
%",ylab="Firmness")
par(mfrow = c(2, 2)) # Split the plotting panel into a 2 x 2
grid
model <- lm(firmness ~ pectin , data=data)
summary(model)
plot(model)
par(mfrow=c(1,1))
# Residual Plot
data$residuals...
 can
i get some help on this question please, thanks!
The values below shows the number of new stores in a coffee shop chain that opened during the years 1986 through 1994. 1986, 14 1987, 27 1988, 48 1989, 80 1990, 110 1991, 153 1992, 261 1993, 403 1994, 681 Use your TI to create two lists L1 for year, L2 for number of new stores. Then create a third list L3 which takes Ln(L2) -- the natural log of...
can
i get some help on this question please, thanks!
The values below shows the number of new stores in a coffee shop chain that opened during the years 1986 through 1994. 1986, 14 1987, 27 1988, 48 1989, 80 1990, 110 1991, 153 1992, 261 1993, 403 1994, 681 Use your TI to create two lists L1 for year, L2 for number of new stores. Then create a third list L3 which takes Ln(L2) -- the natural log of...
 For expert using R , I solve it but i need to figure out what
I got is correct or wrong. Thank you
# Simple Linear Regression and Polynomial Regression
# HW 2
#
# Read data from csv file
data <-
read.csv("C:\data\SweetPotatoFirmness.csv",header=TRUE,
sep=",")
head(data)
str(data)
# scatterplot of independent and dependent variables
plot(data$pectin,data$firmness,xlab="Pectin,
%",ylab="Firmness")
par(mfrow = c(2, 2)) # Split the plotting panel into a 2 x 2
grid
model <- lm(firmness ~ pectin , data=data)
summary(model)
anova(model)
plot(model)...
For expert using R , I solve it but i need to figure out what
I got is correct or wrong. Thank you
# Simple Linear Regression and Polynomial Regression
# HW 2
#
# Read data from csv file
data <-
read.csv("C:\data\SweetPotatoFirmness.csv",header=TRUE,
sep=",")
head(data)
str(data)
# scatterplot of independent and dependent variables
plot(data$pectin,data$firmness,xlab="Pectin,
%",ylab="Firmness")
par(mfrow = c(2, 2)) # Split the plotting panel into a 2 x 2
grid
model <- lm(firmness ~ pectin , data=data)
summary(model)
anova(model)
plot(model)...
 Styles The data in the accompanying table represent the population of a certain country every 10 years for the years 1900-2000. An ecologist is interested in finding an equation that describes the population of the country over time. Complete parts (a) through (3) below Year, x 1900 1910 1920 1930 1940 1950 Population, y Year, x Population, y 179,323 203,302 79,212 1960 95,228 1970 104,021 1980 123,202 1990 132,164 2000 151,325 226,542 248,709 281,421 (a)Determine the least-squares regression equation, treating...
 Statistics Question Help Please
Exercise 2: In a study, scientists examine data on the "Sea temperature" (variable r, in celsius) and "Coral growth" (response y, in millimetres) over a several-years period in the Gulf of Mexico and the Caribbeans. The scatterplot in graph A displays the relationship between and y 262 26.7 263 264 26.5 26.0 Sea Tamperature Answer the following questions providing all the mathematical details. 1. Which regression line (in graphs A and B) fits well the scatterplot?...
Statistics Question Help Please
Exercise 2: In a study, scientists examine data on the "Sea temperature" (variable r, in celsius) and "Coral growth" (response y, in millimetres) over a several-years period in the Gulf of Mexico and the Caribbeans. The scatterplot in graph A displays the relationship between and y 262 26.7 263 264 26.5 26.0 Sea Tamperature Answer the following questions providing all the mathematical details. 1. Which regression line (in graphs A and B) fits well the scatterplot?...
 0.2 pts) Based upon the data what can you say about the mean size of leaves you would expect on trees that are 20 meters away from the road? (explain your reasoning) (k, 2 pts) Based upon the data what can you say about the mean size of leaves you would expect on trees that are 30 meters away from the road? (explain your reasoning) (1.2 pts) Based upon your results above can we conclude that pollution from the road...
 I need help from 9-11.
I calculated 7-8 below.
7)Alcohol Consumption (liters/person/year): 3
Heart disease =
260.56-22.969(3)
= 191.653
8) Alcohol Consumption (liters/person/year): 15
Heart disease =
260.56-22.969(15)
= -83.975
It wouldn’t be appropriate because the heart disease is
in -83.975.
The following table presents data on wine consumption (in liters per person per year) and death rate from heart attacks (in deaths per 100,000 people per year) in 19 developed Western countries. WINE CONSUMPTION AND HEART ATTACKS Alcohol Heart...
I need help from 9-11.
I calculated 7-8 below.
7)Alcohol Consumption (liters/person/year): 3
Heart disease =
260.56-22.969(3)
= 191.653
8) Alcohol Consumption (liters/person/year): 15
Heart disease =
260.56-22.969(15)
= -83.975
It wouldn’t be appropriate because the heart disease is
in -83.975.
The following table presents data on wine consumption (in liters per person per year) and death rate from heart attacks (in deaths per 100,000 people per year) in 19 developed Western countries. WINE CONSUMPTION AND HEART ATTACKS Alcohol Heart...
 I wonder only both (d) and (e).
If you use excel, please show what you do exactly.
Please help me. Thanks.
ts) Can-Do Canoe sells lightweight portable canoes. Quarterly demand for its most 2. (70 point ar product family over the past 3 years has been as follows. popul 2015 2 2016 2 2017 Year Demand 25 120 40 60 30 140 608035 150 55 90 4 Quarter a) (10 points) Use an exponential smoothing model with smoothing constant a...
I wonder only both (d) and (e).
If you use excel, please show what you do exactly.
Please help me. Thanks.
ts) Can-Do Canoe sells lightweight portable canoes. Quarterly demand for its most 2. (70 point ar product family over the past 3 years has been as follows. popul 2015 2 2016 2 2017 Year Demand 25 120 40 60 30 140 608035 150 55 90 4 Quarter a) (10 points) Use an exponential smoothing model with smoothing constant a...
 I only need help for the last question
"What Went Wrong?". Thank you!
After seeing the problem, your classmate Alice immediately argues that we can apply a linear regression model, as the labels are numbers from 0-9, very similar to the example we learned from Unit 1. Though being a little doubtful, you decide to have a try and start simple by using the raw pixel values of each image as features. Alice wrote a skeleton code run_linear_regression_on_MNIST in main.py,...
I only need help for the last question
"What Went Wrong?". Thank you!
After seeing the problem, your classmate Alice immediately argues that we can apply a linear regression model, as the labels are numbers from 0-9, very similar to the example we learned from Unit 1. Though being a little doubtful, you decide to have a try and start simple by using the raw pixel values of each image as features. Alice wrote a skeleton code run_linear_regression_on_MNIST in main.py,...
 Please I want someone help me to solve this question
a,b,c,d,e
I’m not sure about my solution
This is the data
# Set directory to data folder
setwd("C:data")
# getwd()
# Read data from csv file
data <- read.csv("SweetPotatoFirmness.csv",header=TRUE,
sep=",")
head(data)
str(data)
# scatterplot of independent and dependent variables
plot(data$pectin,data$firmness,xlab="Pectin,
%",ylab="Firmness")
par(mfrow = c(2, 2)) # Split the plotting panel into a 2 x 2
grid
model <- lm(firmness ~ pectin , data=data)
summary(model)
plot(model)
par(mfrow=c(1,1))
# Residual Plot
data$residuals...
Please I want someone help me to solve this question
a,b,c,d,e
I’m not sure about my solution
This is the data
# Set directory to data folder
setwd("C:data")
# getwd()
# Read data from csv file
data <- read.csv("SweetPotatoFirmness.csv",header=TRUE,
sep=",")
head(data)
str(data)
# scatterplot of independent and dependent variables
plot(data$pectin,data$firmness,xlab="Pectin,
%",ylab="Firmness")
par(mfrow = c(2, 2)) # Split the plotting panel into a 2 x 2
grid
model <- lm(firmness ~ pectin , data=data)
summary(model)
plot(model)
par(mfrow=c(1,1))
# Residual Plot
data$residuals...
Most questions answered within 3 hours.
-
The following exchange rates are available to you to buy or
sell.
Mt. Fuji Bank
JPY120.00/USD...
asked 22 minutes ago -
Does smoking hurt the lungs of children’s who are exposed to
adult smoking?
Forced vital capacity...
asked 1 hour ago -
EXPLAIN HOW NEGATIVE AFFECTIVITY IS RELATED TO JOB SATISFACTION.
INCLUDE AN EXAMPLE. MUST BE ANSWERED TWO...
asked 2 hours ago -
On December 31, 2019, Lincoln Inc. sold a used industrial crane
for $660,000 cash. The original...
asked 3 hours ago -
a runner jogs 3.4 miles every morning. how many kilometers does
this represent
asked 3 hours ago -
A 60.80 gram sample of iron (with a heat capacity of 0.450
J/g◦C) is heated to...
asked 3 hours ago -
Question 1 2 pts
The preprocessor executes after the compiler.
False
True
Question 2 2 pts...
asked 4 hours ago -
Explain how a spinal cord injury above C3 could result in a
respiratory arrest
asked 4 hours ago -
You are a statistician and wish to estimate, with 90%
confidence, the proportion of adults who...
asked 7 hours ago -
A man is standing 3.40 m in front of a convex spherical mirror
of radius of...
asked 7 hours ago -
Match the annual percentage rate to each of these trade credit
terms:
__ 1/5, NET 60...
asked 7 hours ago -
ORGANIC CHEMISTRY QUESTION 5
PART A--------
Describe a chemical test for the identification of a double...
asked 11 hours ago